This week at the ACUMA 2025 Annual Conference, my team explored a critical theme: a credit union's loan portfolio doesn't exist in a vacuum. To truly understand your risk, you must look beyond your own data. Agency loan performance data provides a powerful mirror, reflecting broader market trends that directly impact your members and your bottom line.
A key example we shared was a startling 47% jump in 60+ day delinquencies from Q1 to Q2 2025, a statistic, based on call reports data by number of loans, that highlights how quickly market conditions can shift.
By analyzing single-family loan performance data from Fannie Mae and Freddie Mac, we can create a benchmark to see how credit unions stack up and where vulnerabilities may lie.
First, the good news: The data shows that credit unions consistently outperform. As of August 1, 2025, the 30-day delinquency rate for loans sold by credit unions was 0.61%, significantly lower than the 0.8059% for all other sellers.
However, the agency data also illuminates specific areas of risk:
One of the most potent emerging risks is prepayment when borrowers seek better rates. We asked, is there a good proxy for savings incentive for rate/term refinancing? One simple proxy is to use the difference between the prevailing mortgage rate and the note rate on the homeowner's loan. Many practitioners use this but we do not advocate for this. The reason for that is that a difference of 100 basis points between the homeowner's note rate and the prevailing rate has a greater impact on borrower's savings if the borrower's note rate is 11% rather than 6%.We found that a better, although not perfect proxy for capturing the refinance incentive to refinance is the ration of the borrower's note rate to the current mortgage rate.
This is what is known as the "Refinance Incentive Ratio". This is the ratio between a member's original interest rate and the current market rate. We kept our analysis narrower by focusing on the Mountain Division. We also used HMDA loan-level data and insight on agency loans average rate and term refinancing mortgage rate in the same geography in August 2025.
Our analysis shows that in the Mountain Division, credit unions originated 26,422 loans from 2022 through 2024 with interest rates at or above 6.5%. For these members, the current refinance incentive ratio stands between 1.11 and 1.13, meaning they are paying a rate 11-13% higher than a readily available refinance offer.
But when does this incentive become strong enough to make a borrower act? While any ratio over 1.0 is a tangible benefit, common industry rules of thumb suggest the real tipping point is a rate reduction of at least 0.75% to 1%. This level of savings translates to a Refinance Incentive Ratio of roughly 1.15 to 1.17. A current ratio of 1.11-1.13 puts credit union members squarely on the radar of competitors. As that ratio climbs towards 1.15, the risk of portfolio runoff will become acute.
True risk management involves understanding how different risks intersect and amplify each other.
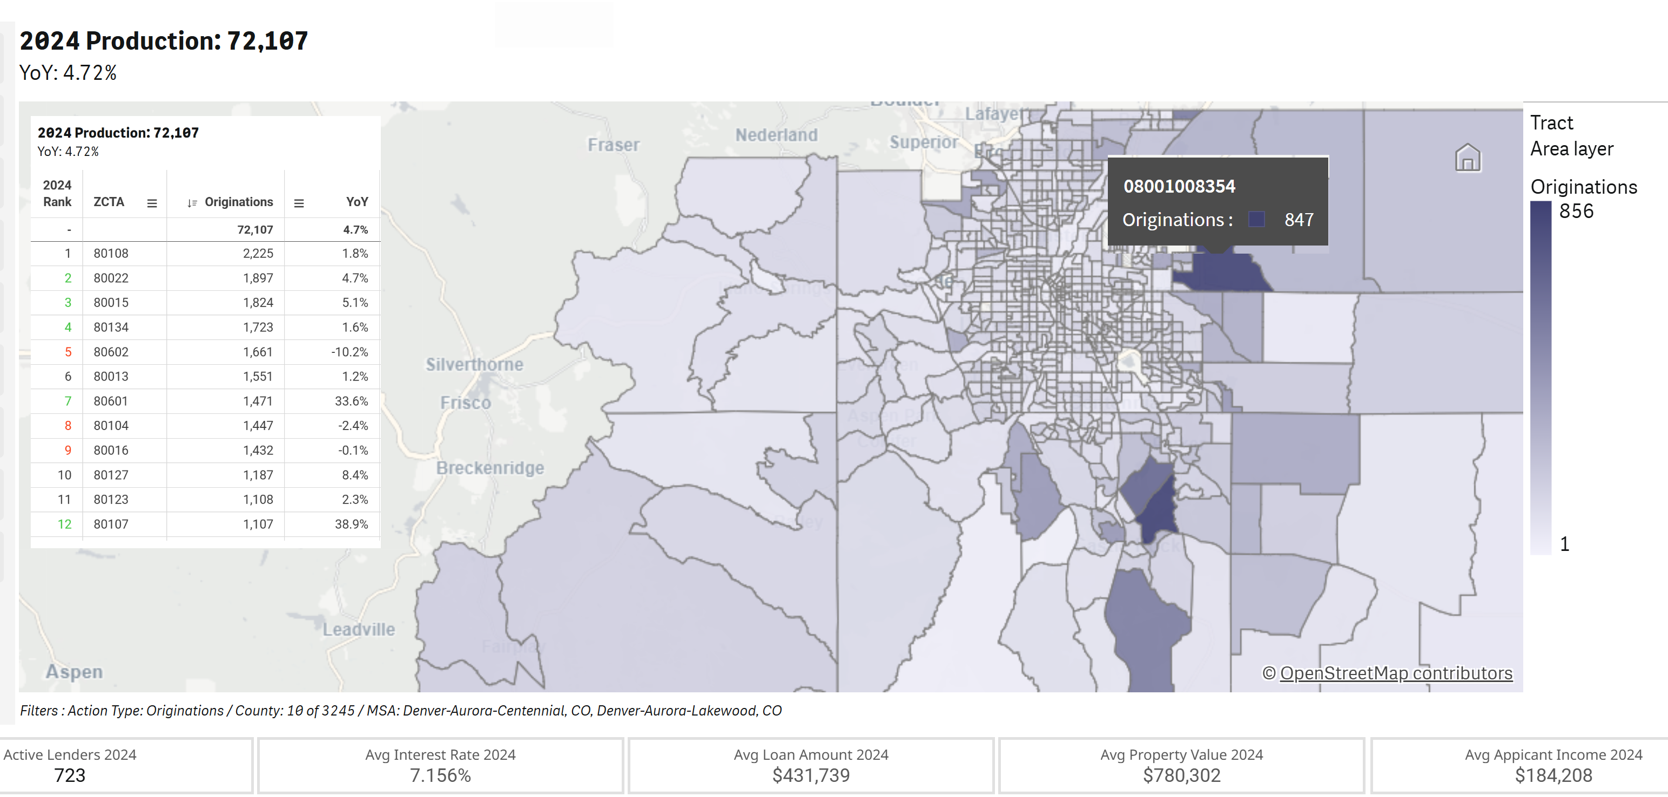
Risk often begins with geography. In the Denver MSA, for example, 2024 origination data shows that just five counties account for the vast majority of lending activity.
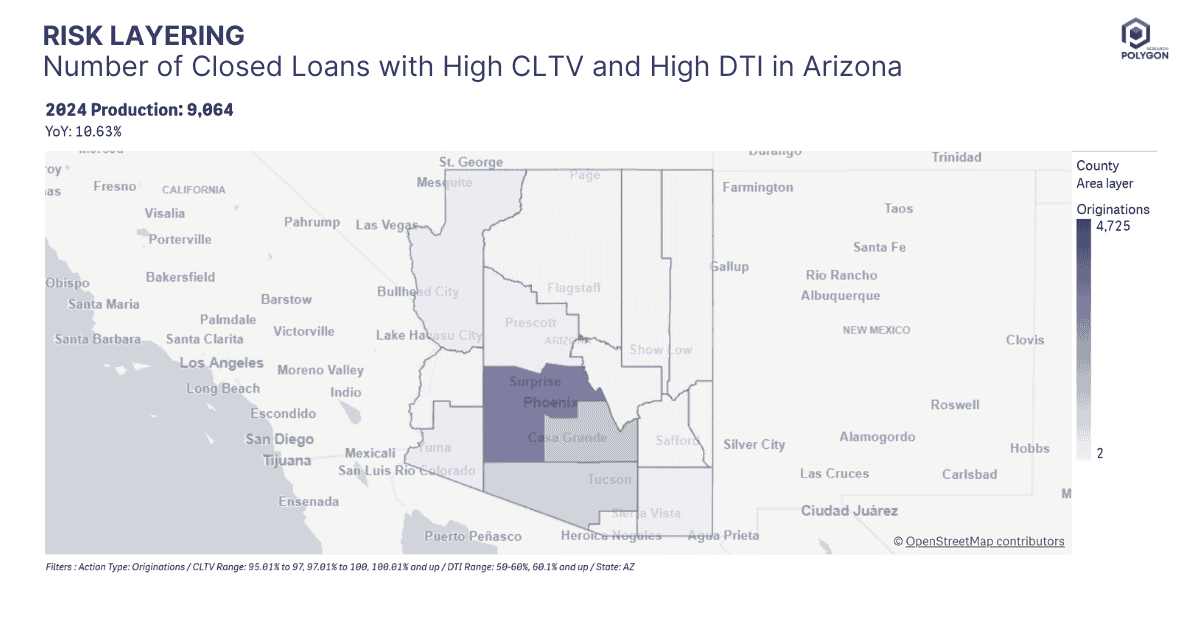
When we filter for high-risk products, like loans with both a high CLTV and a high DTI, the picture becomes more focused. In Arizona, these loans are intensely concentrated in Maricopa and Pinal counties, a much more alarming type of concentration. Add to this loan purpose - cash-out refinance, and we can see a more focused picture of risk.
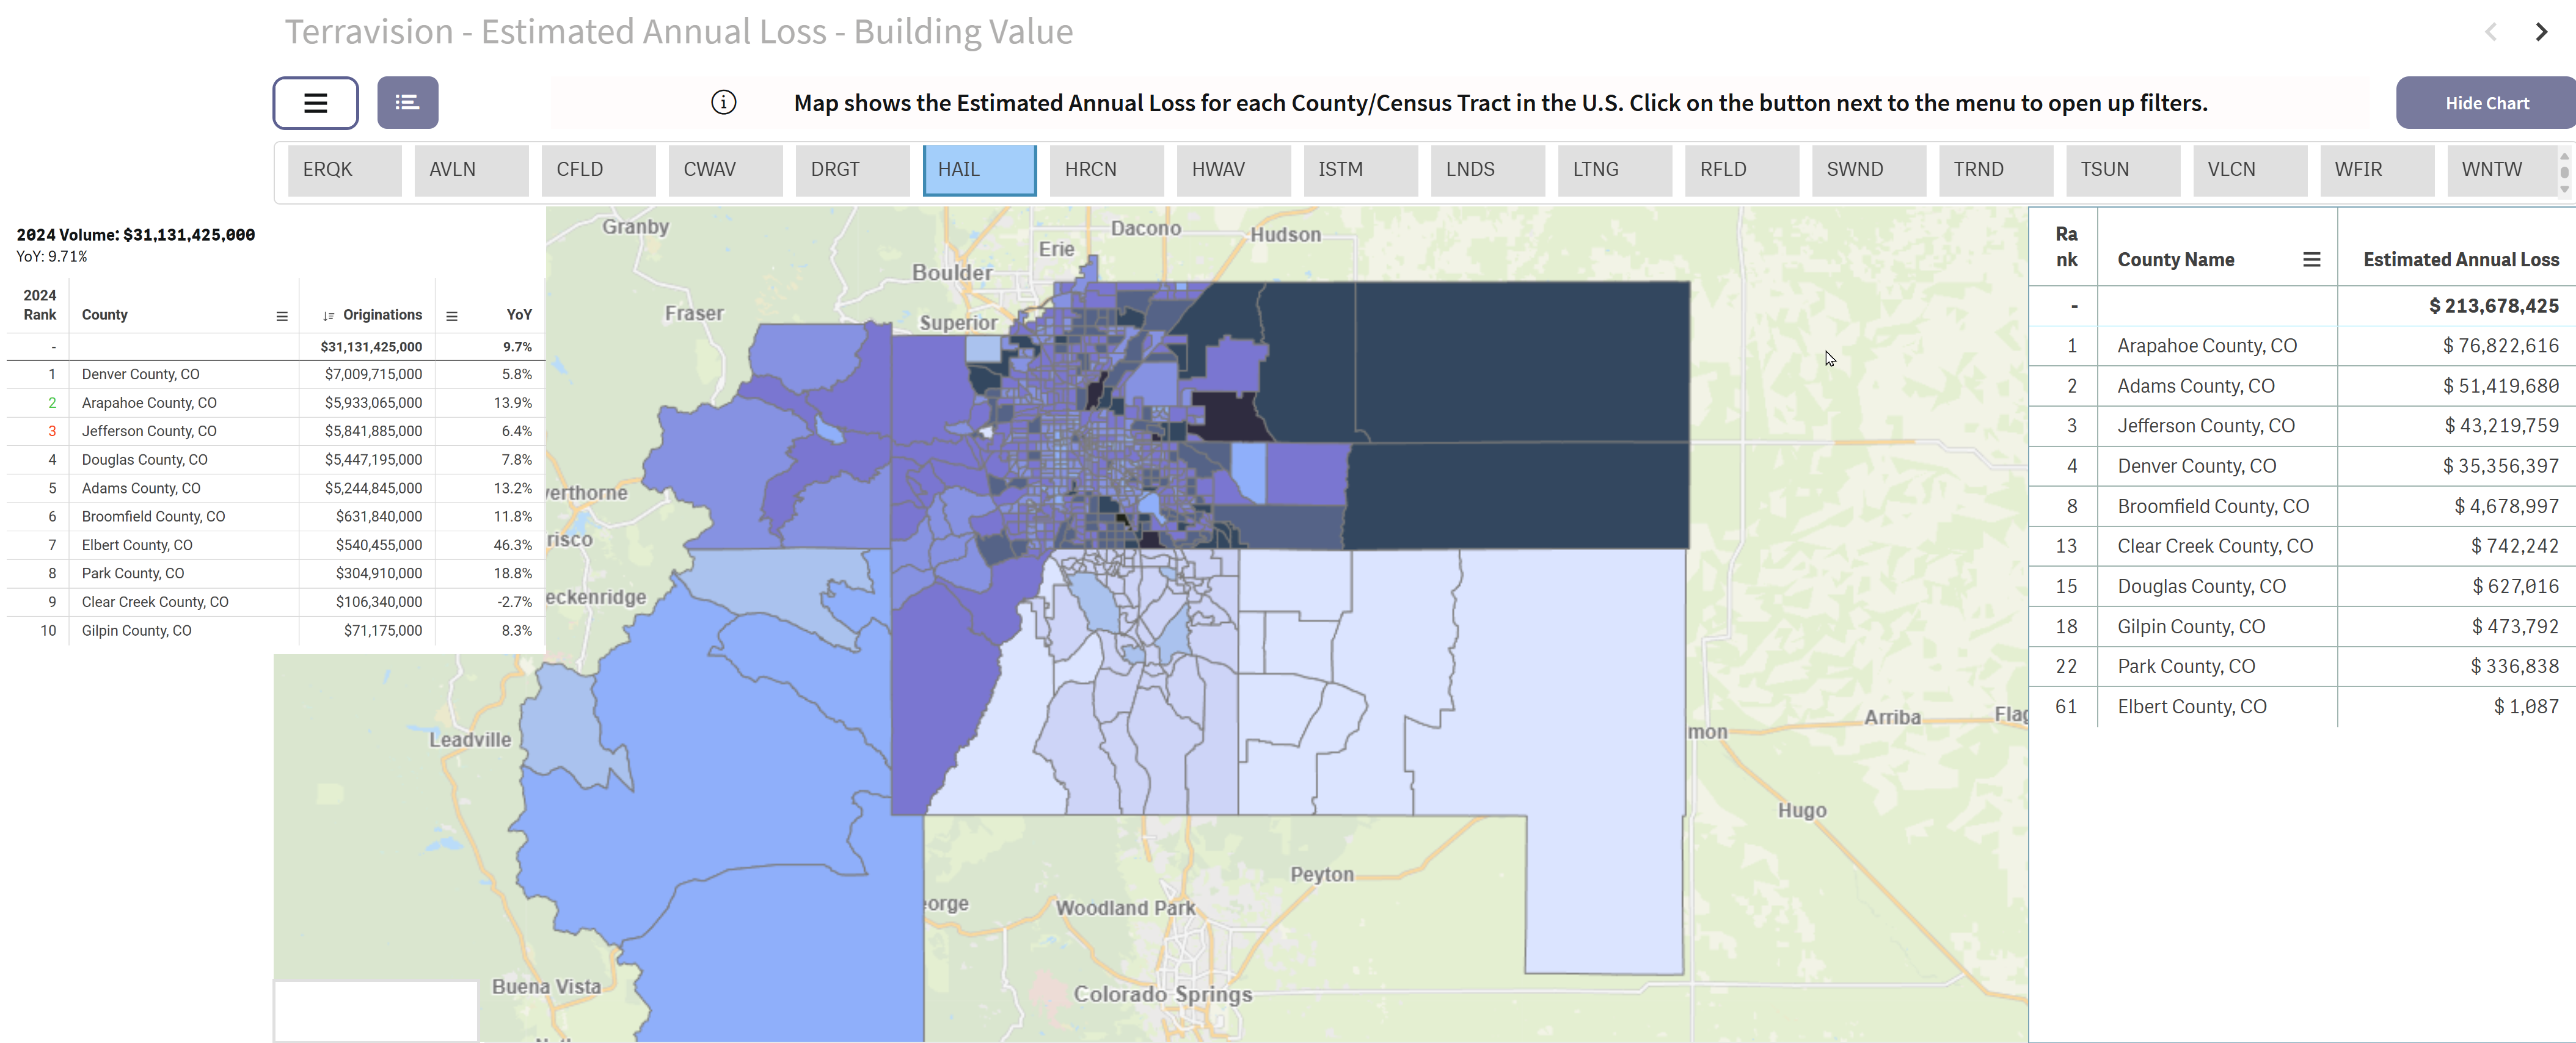
Natural disasters by themselves are concerning but it is when we combine their impact on housing and mortgage collateral that they become critical to identify, measure, and monitor. Layering natural disaster data on top of geographic concentration of mortgage activity magnifies the potential for loss. Colorado accounts for 15% of the entire U.S. estimated annual building loss from hail, and the frequency of billion-dollar disasters in the state has more than doubled in the last five years. Below is a snapshot of our Terra Vision tool showing the estimated annual loss of building value by county and census tract. On the left, the table shows the number of loans originated in 2024 by county in dollar volume and by growth rate.
A concern is the size of the mortgage market in Arapahoe County (~$6 Billion with 13.9% year-over-year increase), and at the same time, Arapahoe County carries the highest amount of estimated annual loss from hail of about $77 million.
Finally, we explored the question of housing turnover. Housing turnover means existing home sales. The two major factors impacting this are:
If you would like to get a copy of the slides to see this analysis, please email us at info@polygonresearch.com
Understanding these external forces is the key to proactive risk management. By using broader market data as a mirror, credit union leaders can move beyond a reactive stance, see the market more clearly, anticipate change, and act with confidence.
Credit unions outperform but emerging risks like delinquencies, refinance incentives, and disaster exposure demand deeper analysis. Learn more from Polygon Research at ACUMA 2025.
This week at the ACUMA 2025 Annual Conference, my team explored a critical theme: a credit union's loan portfolio doesn't exist in a vacuum. To truly understand your risk, you must look beyond your own data. Agency loan performance data provides a powerful mirror, reflecting broader market trends that directly impact your members and your bottom line.
A key example we shared was a startling 47% jump in 60+ day delinquencies from Q1 to Q2 2025, a statistic, based on call reports data by number of loans, that highlights how quickly market conditions can shift.
By analyzing single-family loan performance data from Fannie Mae and Freddie Mac, we can create a benchmark to see how credit unions stack up and where vulnerabilities may lie.
First, the good news: The data shows that credit unions consistently outperform. As of August 1, 2025, the 30-day delinquency rate for loans sold by credit unions was 0.61%, significantly lower than the 0.8059% for all other sellers.
However, the agency data also illuminates specific areas of risk:
One of the most potent emerging risks is prepayment when borrowers seek better rates. We asked, is there a good proxy for savings incentive for rate/term refinancing? One simple proxy is to use the difference between the prevailing mortgage rate and the note rate on the homeowner's loan. Many practitioners use this but we do not advocate for this. The reason for that is that a difference of 100 basis points between the homeowner's note rate and the prevailing rate has a greater impact on borrower's savings if the borrower's note rate is 11% rather than 6%.We found that a better, although not perfect proxy for capturing the refinance incentive to refinance is the ration of the borrower's note rate to the current mortgage rate.
This is what is known as the "Refinance Incentive Ratio". This is the ratio between a member's original interest rate and the current market rate. We kept our analysis narrower by focusing on the Mountain Division. We also used HMDA loan-level data and insight on agency loans average rate and term refinancing mortgage rate in the same geography in August 2025.
Our analysis shows that in the Mountain Division, credit unions originated 26,422 loans from 2022 through 2024 with interest rates at or above 6.5%. For these members, the current refinance incentive ratio stands between 1.11 and 1.13, meaning they are paying a rate 11-13% higher than a readily available refinance offer.
But when does this incentive become strong enough to make a borrower act? While any ratio over 1.0 is a tangible benefit, common industry rules of thumb suggest the real tipping point is a rate reduction of at least 0.75% to 1%. This level of savings translates to a Refinance Incentive Ratio of roughly 1.15 to 1.17. A current ratio of 1.11-1.13 puts credit union members squarely on the radar of competitors. As that ratio climbs towards 1.15, the risk of portfolio runoff will become acute.
True risk management involves understanding how different risks intersect and amplify each other.
Risk often begins with geography. In the Denver MSA, for example, 2024 origination data shows that just five counties account for the vast majority of lending activity.
When we filter for high-risk products, like loans with both a high CLTV and a high DTI, the picture becomes more focused. In Arizona, these loans are intensely concentrated in Maricopa and Pinal counties, a much more alarming type of concentration. Add to this loan purpose - cash-out refinance, and we can see a more focused picture of risk.
Natural disasters by themselves are concerning but it is when we combine their impact on housing and mortgage collateral that they become critical to identify, measure, and monitor. Layering natural disaster data on top of geographic concentration of mortgage activity magnifies the potential for loss. Colorado accounts for 15% of the entire U.S. estimated annual building loss from hail, and the frequency of billion-dollar disasters in the state has more than doubled in the last five years. Below is a snapshot of our Terra Vision tool showing the estimated annual loss of building value by county and census tract. On the left, the table shows the number of loans originated in 2024 by county in dollar volume and by growth rate.
A concern is the size of the mortgage market in Arapahoe County (~$6 Billion with 13.9% year-over-year increase), and at the same time, Arapahoe County carries the highest amount of estimated annual loss from hail of about $77 million.
Finally, we explored the question of housing turnover. Housing turnover means existing home sales. The two major factors impacting this are:
If you would like to get a copy of the slides to see this analysis, please email us at info@polygonresearch.com
Understanding these external forces is the key to proactive risk management. By using broader market data as a mirror, credit union leaders can move beyond a reactive stance, see the market more clearly, anticipate change, and act with confidence.