The HMDA Benchmark Guide
A practical guide for credit union mortgage leaders and industry partners.
We explain each section of the report—what to look for, what it means, and how to use it to set priorities across lending, marketing, operations, and compliance.
Reading Your National Performance Like a Strategist
Think of page 1 of the ACUMA Benchmark Report as your mortgage lending vital signs monitor - each metric tells part of your operational health story.
On this page, pay attention to the Key Performance Indicators (KPIs) on top especially the direction of your applications and originations, and your pull-through rate. In the table, consider your rank in your top counties, whether your strategy worked (the year-over-year change), and the Borrower Shopping Index (BSI). Read more below.
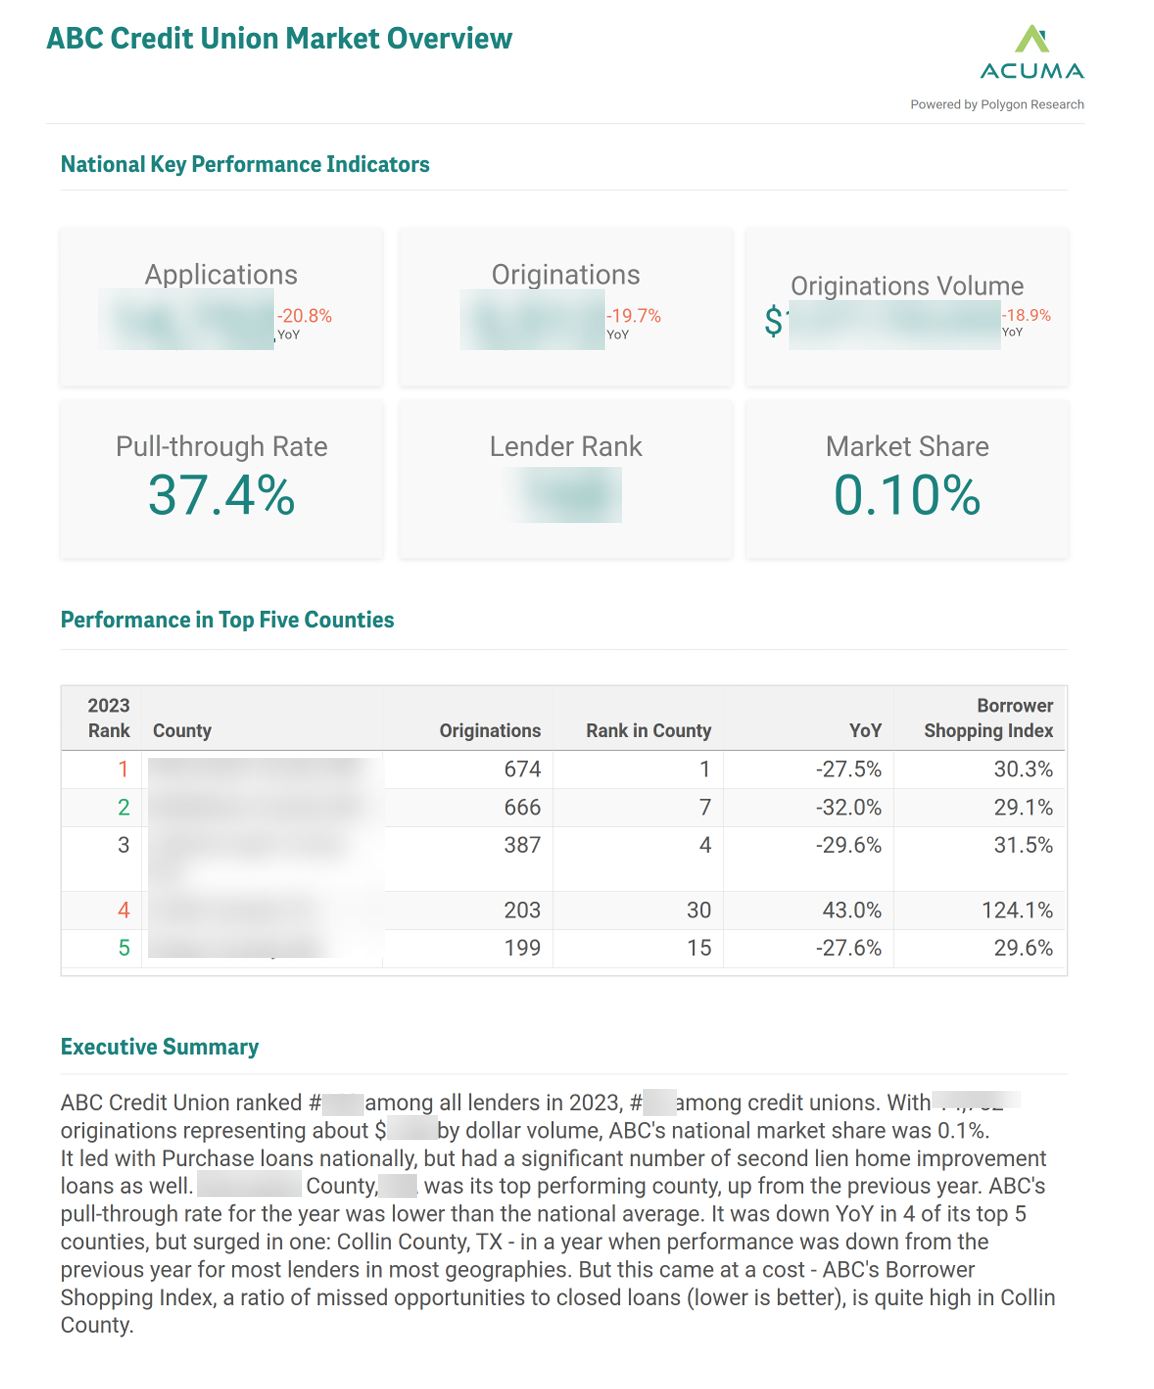
Pull-Through
Pull through is calculated as the percent of applications that get funded. The pull-through rate is your operational efficiency heartbeat. Below 50%? You're probably bleeding opportunities. Above 80%? You're likely either very efficient or very selective. This number alone often reveals whether your biggest opportunity is in marketing or operations.
When applications are up but originations are down, you have a conversion problem, not a marketing problem. Stop spending money on lead generation and start fixing your funnel. Each lost application represents hundreds of thousands in loan volume walking away.
When both applications and originations are down, you're facing a market challenge that requires both strategic and operational response. We've seen economic headwinds and increased competition in the last 2-3 years, but this could also be a fundamental shift in your market position. Now is the time to analyze whether this is a temporary market cycle or a strategic wake-up call that demands broader changes to your approach.
Borrower Shopping Index
The Borrower Shopping Index is the percentage of your members who applied for mortgages but chose to go elsewhere, either withdrawing their applications or declining your approval to get financing from competitors. What are the strategic applications of the BSI?
When your shopping index is high (40%+), your members are shopping around and finding better deals elsewhere. Focus on pricing competitiveness, service speed, or communication gaps. But before you do that, you have to understand the driving forces behind the high BSI - is it product-market fit, or loyalty issue?
It's possible that your shopping index varies dramatically by geography. Your members in some markets see you as their obvious choice, while members in other markets treat you like any other lender. Investigate what makes your strong markets different - is it the local relationships you cultivate, your branch presence, or your competitive positioning?
The member relationship opportunity. Every point improvement in the shopping index represents members you're keeping instead of losing to competitors, strengthening lifetime value and relationship depth.
Your Top County Analysis
The deep dive into your strongest performing county is strategic intelligence that shows you exactly what works, where it works, and how to replicate it. The first insight in the report is benchmarking your lending patterns across demographic groups (by age). The table compares the distribution of your loans by demographic group to the distribution of originations of the market, and calculates "parity" score (see below).
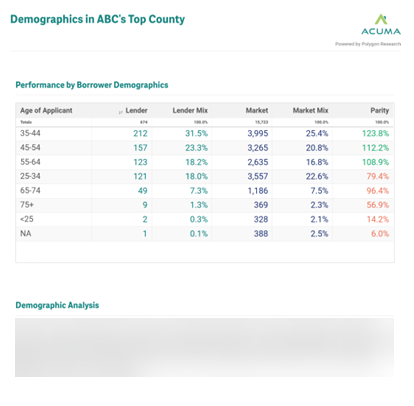
Understanding the Parity Score
Parity over 100% (green). You're more focused on this segment than your competitors. Think of these as your strength segments.
Parity under 100% (red). Compared to others in the market, you're underfocused on this demographic. These are your growth targets.
Here are some of the actionable insights from this example.
- For example, with your strength segments (like 35-44 with 123.8% parity), you can use them to analyze what messaging, products, or service approach resonates with this group and replicate it for other segments.
- For your opportunity segments (like 25-34 with 79.4% parity), you can investigate barriers - is it pricing, product features, marketing channels, or service preferences that aren't connecting with these members? The 25-34 year old demographic segment represents major growth potential, not only in mortgage but all other credit union services. Read our report on credit union opportunities with young borrowers.
Strategic Questions
After you do your analysis and have the data, you can ask (and should be able to confidently answer them) these strategic questions:
- Where should you direct marketing spend for maximum impact?
- What mortgage features appeal to your underperforming segments?
- Which other markets have similar demographics to your strength segments?
If you're this successful with certain age groups in your top county, which other markets in your field of membership have similar demographics where you could replicate this success?
This is where comprehensive analysis becomes invaluable - finding your demographic strengths across all the markets you serve.
Loan Pricing Intelligence
This page of the Benchmark Report provides insight into the results of your pricing strategy in your top county. The pull-through rate is specific to your top county, and so are the other metrics - average interest rate, discount points, lender credits, services, and TIP (HMDA). Let's break this down further.
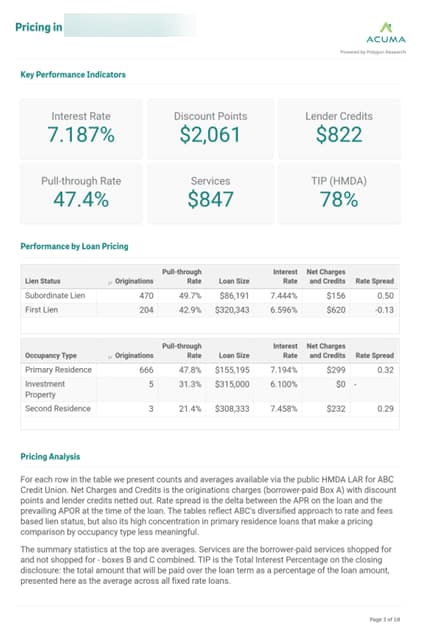
Loan Pricing Metrics
The analysis highlights the overall KPIs for your pricing strategy on the top of the page. Each box shows the average metric in that category. The two tables summarize the loan pricing outcomes by Lien Status and by Occupancy Type. These KPIs express what your members paid for loans with your credit union.
The interest rate, discount points, lender credits are reported directly from the Closing Disclosure. The TIP is the Total Percentage Interest paid over the life of the loan and is disclosed on the CD but not reported by the lenders. But we calculate it and include it in our pricing analysis.
We've identified three areas that you can immediately apply your findings to.
If your rates are higher than peers but your pull-through rate is strong, you're winning on value, not price. If rates are competitive but pull-through is weak, investigate service or process issues.
Low discount points compared to peers might signal opportunity to offer rate-buydown options. High lender credits could indicate you're absorbing costs that competitors pass to borrowers.
Rate spread variations across demographics reveal both compliance considerations and market expansion opportunities.
Operational Efficiency Benchmarking
This page exposes exactly where you're losing members and revenue in your mortgage process, and shows you where to focus improvement efforts for maximum impact.
The Application Lifecycle
The waterfall chart shows your conversion process step-by-step. Each drop represents lost opportunity and helps you prioritize operational improvements.
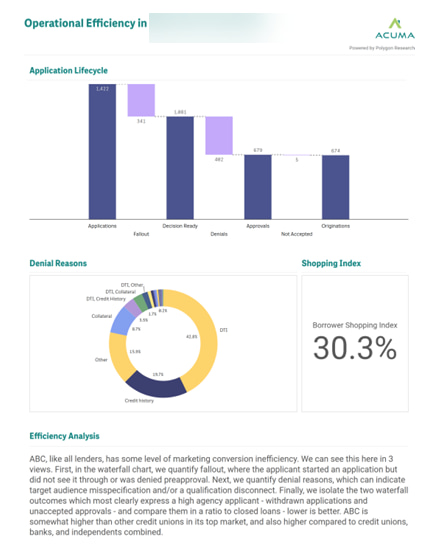
Large fallout numbers suggest process friction, communication gaps, or competitive timing issues. Small fallout with high denials indicates underwriting or qualification challenges.
High denial rates after reaching decision-ready stage often indicate either overly optimistic pre-qualification or underwriting standards misaligned with your target market.
Denial Reasons
The Benchmark Report shows the reasons why you declined an application. By analyzing the denial reasons, you can uncover patterns that you should leverage to improve loan offerings or processes.
If DTI is your primary denial reason, you might be missing product opportunities (longer terms, different rate structures) or targeting members outside your lending parameters.
High credit history denials suggest either conservative underwriting or opportunities to develop risk-based pricing strategies.
Collateral denial reason typically indicates appraisal challenges, property type restrictions, or geographic market knowledge gaps.
Local Borrower Shopping Index
We discussed Borrower Shopping Index above. At a local level, this index should be your competitive urgency metric. For example, when you see a shopping index of 30.3%, as shown in our example, it means that roughly 3 out of 10 members choose competitors. This is your most expensive inefficiency - you've invested in processing and underwriting but get no revenue. High shopping indices often correlate with slow decision timelines. Members approve elsewhere while waiting for your answer. Approved members who shop around may not understand your value proposition or competitive advantages.
Each operational improvement here directly impacts revenue - faster decisions, clearer communication, and competitive positioning turn process efficiency into profit recovery.
Fair Lending Benchmarks
Fair lending benchmarks begin on page 5. You can see the fair lending gaps for sure. But the analysis also reveals your biggest untapped market opportunities hiding in plain sight.
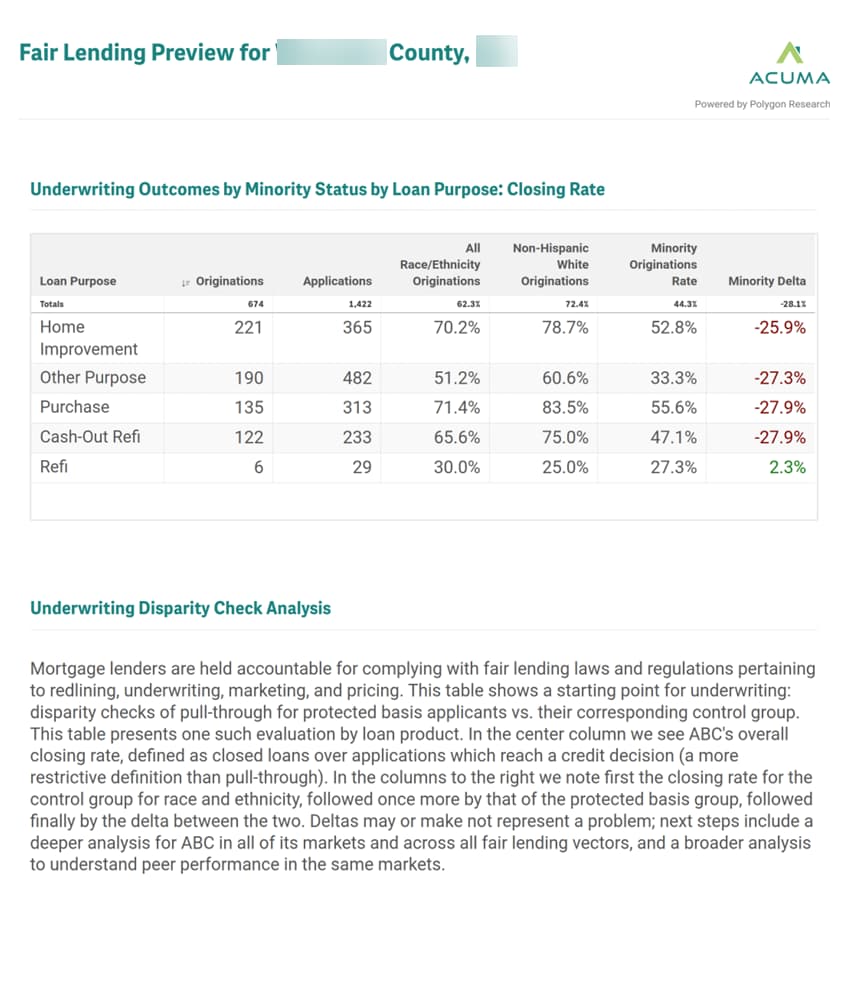
Think of the minority delta as your credit union's opportunity compass. It measures the gap between your originations (closing) rates for non-Hispanic white borrowers versus minority borrowers. Here's the twist: those red negative numbers beyond their fair lending urgency are also flashing neon signs pointing to underserved member segments ready to drive your growth.
Negative deltas (those red numbers) mean minority members face barriers that limit both their access and your volume. Positive deltas are rare but worth celebrating - they show you're doing something right. But those large gaps? They're your biggest growth opportunities dressed up as compliance concerns.
When you break down minority deltas by loan purpose and lien status, you're essentially getting a treasure map for product development. That -25.9% delta in Home Improvement is a business case for process improvements that could unlock substantial member demand.
Here's how smart credit unions use these insights. First, they treat negative deltas as untapped member segments waving money at them. And second, they recognize that consistent disparities reveal bottlenecks hurting both compliance scores and their bottom line.
Improving fair lending outcomes expands your addressable market, strengthens member loyalty, and positions you as the go-to lender in growing diverse communities where your competitors have failed to connect.
This analysis covers one county by design (the report is scoped to the top county for each credit union). However, we recommend that you perform a comprehensive fair lending analysis across your entire field of membership.
Peer Benchmarking: Market Share
Your numbers in a vacuum are just that - numbers in a vacuum. Peer benchmarking reveals whether you're celebrating mediocre results or missing your own exceptional performance.
The market share analysis shows you exactly where you're winning and where competitors are eating your lunch. In this example, ABC Credit Union owns Home Improvement lending with 1.41% market share but barely shows up in Refinance at 0.04%. You can use this insight as a strategic roadmap.
.jpg)
Look at who's listed alongside you in each category. This analysis is showing you exactly who's capturing the business you're missing and how much volume they're moving. When Rocket Mortgage has 2.37% of the Cash-Out Refi market and you have 0.78%, that gap represents real dollars walking out your door.
The beauty of this analysis is it forces uncomfortable but necessary questions. Why does ABC dominate Home Improvement but barely register in Refinance? Did they crack some code with pricing, process, or member relationships that they could replicate elsewhere? Or is that 0.04% Refi share screaming that members don't even know they offer refinancing?
This isn't about feeling good or bad about your performance. This analysis and exercise is about making smart resource allocation decisions. Should you double down on your Home Improvement dominance or invest heavily in capturing more Purchase and Refi market share? The answer depends on your capacity, competition, and member needs.
The real value of this analysis is in the specific competitive intelligence that tells you where to compete, where to invest, and where you might be wasting resources fighting battles you can't win.
Peer Benchmarking: Pull-Through
Every mortgage application is a vote of confidence in your credit union. Your pull-through rates show if you’re earning that trust or pushing members to look elsewhere for their big financial moves. In the Benchmark Report, we devote an entire page on this topic.
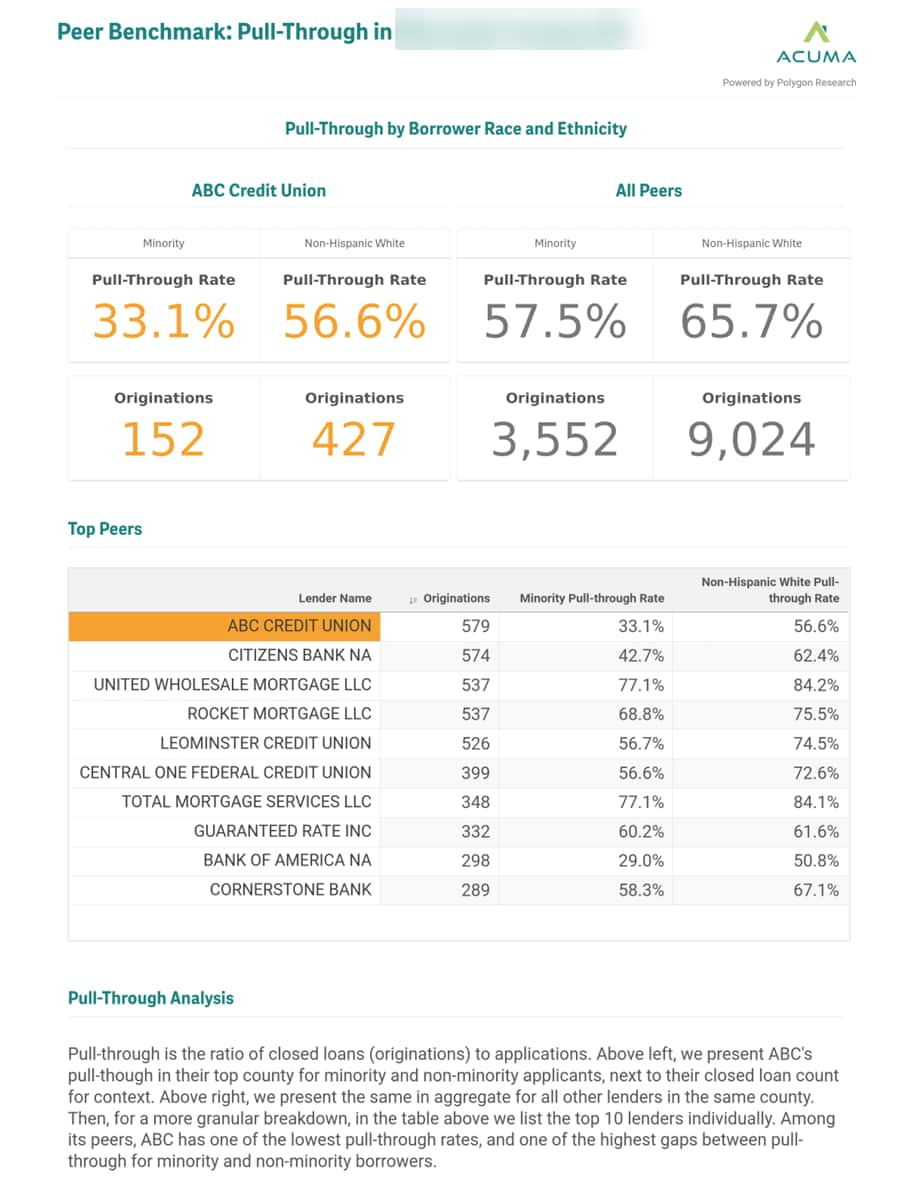
ABC Credit Union’s numbers paint a clear picture. In their top county, their minority pull-through rate sits at 33.1%, well below the 57.5% peer average. What does this mean? One interpretation is that they’re losing nearly 25% more minority applicants than similar lenders. Even for non-Hispanic white members, ABC’s 56.6% lags behind the 65.7% peer benchmark.
Check the peer table. United Wholesale Mortgage converts 77.1% of minority applications, while ABC manages just 33.1%. That gap? It’s real member relationships ABC starts but doesn’t finish, often sending folks to competitors who know how to seal the deal. Rocket Mortgage, with a 68.8% minority pull-through, is building stronger ties with the very segments where ABC struggles.
This county-wide snapshot is just the beginning. Digging into loan purpose, income levels, property types, and more reveals the full story. That’s where Polygon Research tools shine - making those deep dives easy and actionable.
Understanding these gaps is the first step to turning things around.
Peer Benchmarking: Loan Pricing
As a mortgage leader, understanding these two pages of your benchmark report offers critical strategic signals, not just data points. They provide a high-level "health check" of your mortgage operations, focusing on your pricing philosophy and your fair lending commitment.
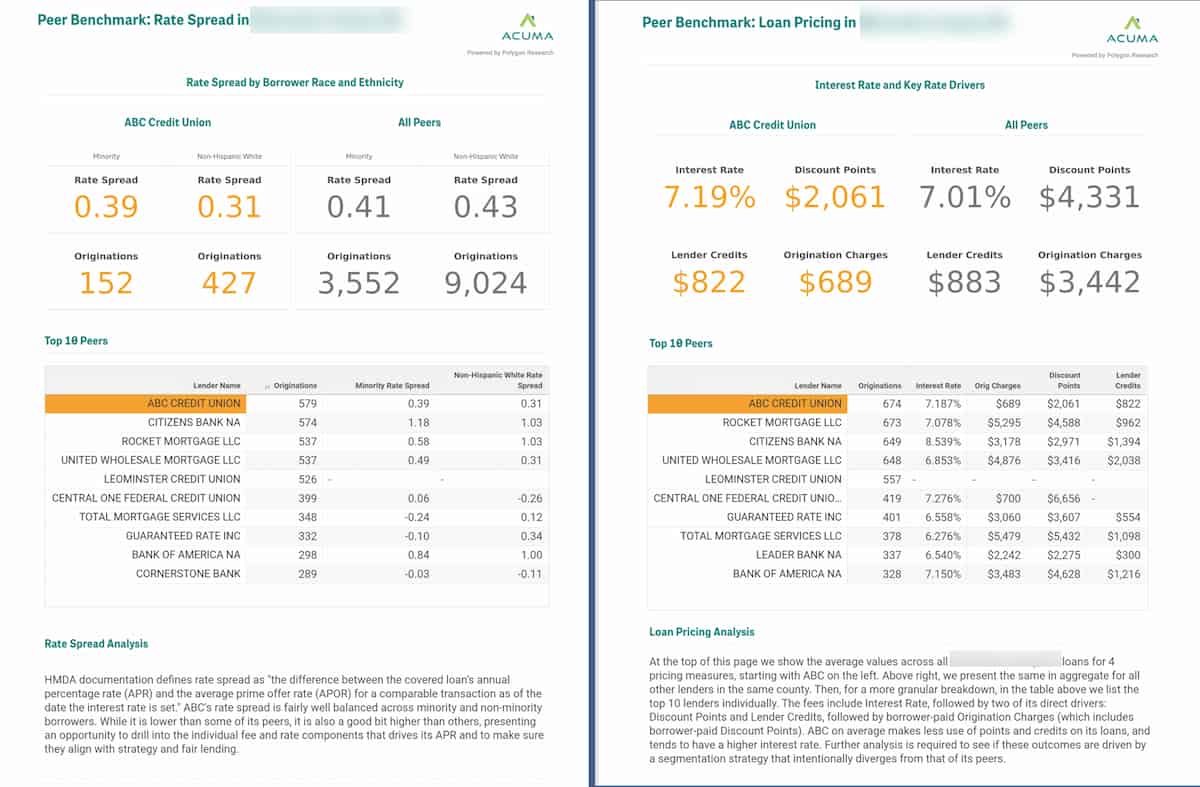
Peer Benchmark: Rate Spread (Left Page)
This view immediately shows you how consistently you price loans across borrower demographics, specifically by race and ethnicity. Tight rate spreads (e.g., 0.39 minority vs. 0.31 non-Hispanic white) indicate strong, consistent fair lending practices.
Beyond essential compliance, balanced rate spreads are a powerful competitive advantage. They build trust, reinforce your credit union's mission for equitable service, and strengthen your community reputation. A wider gap, while not immediately a red flag, signals where deeper analysis is warranted to understand underlying drivers.
Peer Benchmark: Loan Pricing (Right Page)
Use this page to get the strategic snapshot of your pricing. Beyond just interest rates, it highlights the interplay of discount points and origination charges. For example, a seemingly higher interest rate might be offset by significantly lower discount points or origination charges. For many credit unions this is a deliberate strategy to focus on total cost for the member, not just the advertised rate. And that reality is a powerful, yet often hidden, value proposition for credit unions.
This view helps you validate or refine your market positioning. Are you truly a low-fee, transparent option, or is your pricing strategy unintentionally impacting competitiveness? It empowers you to align your operational reality with your strategic intent.
These pages empower you to identify strengths, spot potential challenges early, and direct your deeper analysis. And with Polygon Research's intuitive tools, these critical analyses become easy and instant and they become actionable insights for truly data-driven strategic decisions.
Your Strategic Intelligence: Maximize Your Market Advantage
As a credit union mortgage leader, you know the power of data. Your benchmark report has already illuminated key strategic opportunities: revealing market strengths, exposing operational gaps, and pinpointing competitive positioning. Now, let's explore how to amplify that intelligence and truly dominate your market.
Foundation vs. Amplification: Your Intelligence Options
Think of your strategic intelligence journey in two powerful stages.
ACUMA Benchmark Reports
Your essential annual diagnostic. This report provides a deep-dive analysis of your strongest market, delivering a foundational understanding of competitive positioning, operational efficiency, and fair lending performance. It's your compass for where to look for strategic opportunities.
Polygon Research Interactive Tools
Our tools transform diagnostic findings into immediate strategic action, and they were used to prepare the Benchmark Reports. You gain complete field of membership analysis, granular demographic optimization across all your markets, and enterprise-level strategic planning capabilities. Your benchmark reveals what's possible; our interactive tools show you how to replicate that success across your entire footprint.
The ROI is Clear
Credit unions originate millions in mortgage volume. Capturing even just one additional loan monthly can generate revenue that far exceeds the investment in advanced market intelligence. Our interactive tools, like Polygon Vision, start at a modest $130/month – a fraction of typical operational expenses, yet with an "extremely high" ROI potential as noted by industry consultants.
Don't just take our word for it: Watch customer success stories.
Ready to Get Started?
Establish your foundation with best-in-class market analytics for your top county
-> GET YOUR ACUMA BENCHMARK REPORT
Ready to Go Further?
Maximize actionable intelligence - unbounded simple, interactive analytics for all your counties, all your competitors
-> TRY POLYGON VISION - 7-DAY FREE TRIAL
-> SCHEDULE A ONE-ON-ONE MARKET INTEL CONSULTATION
