Polygon Vision is the only one, application-level suite of market intel tools, enriched with granular NMLS, housing data, and local demographics.

.avif)

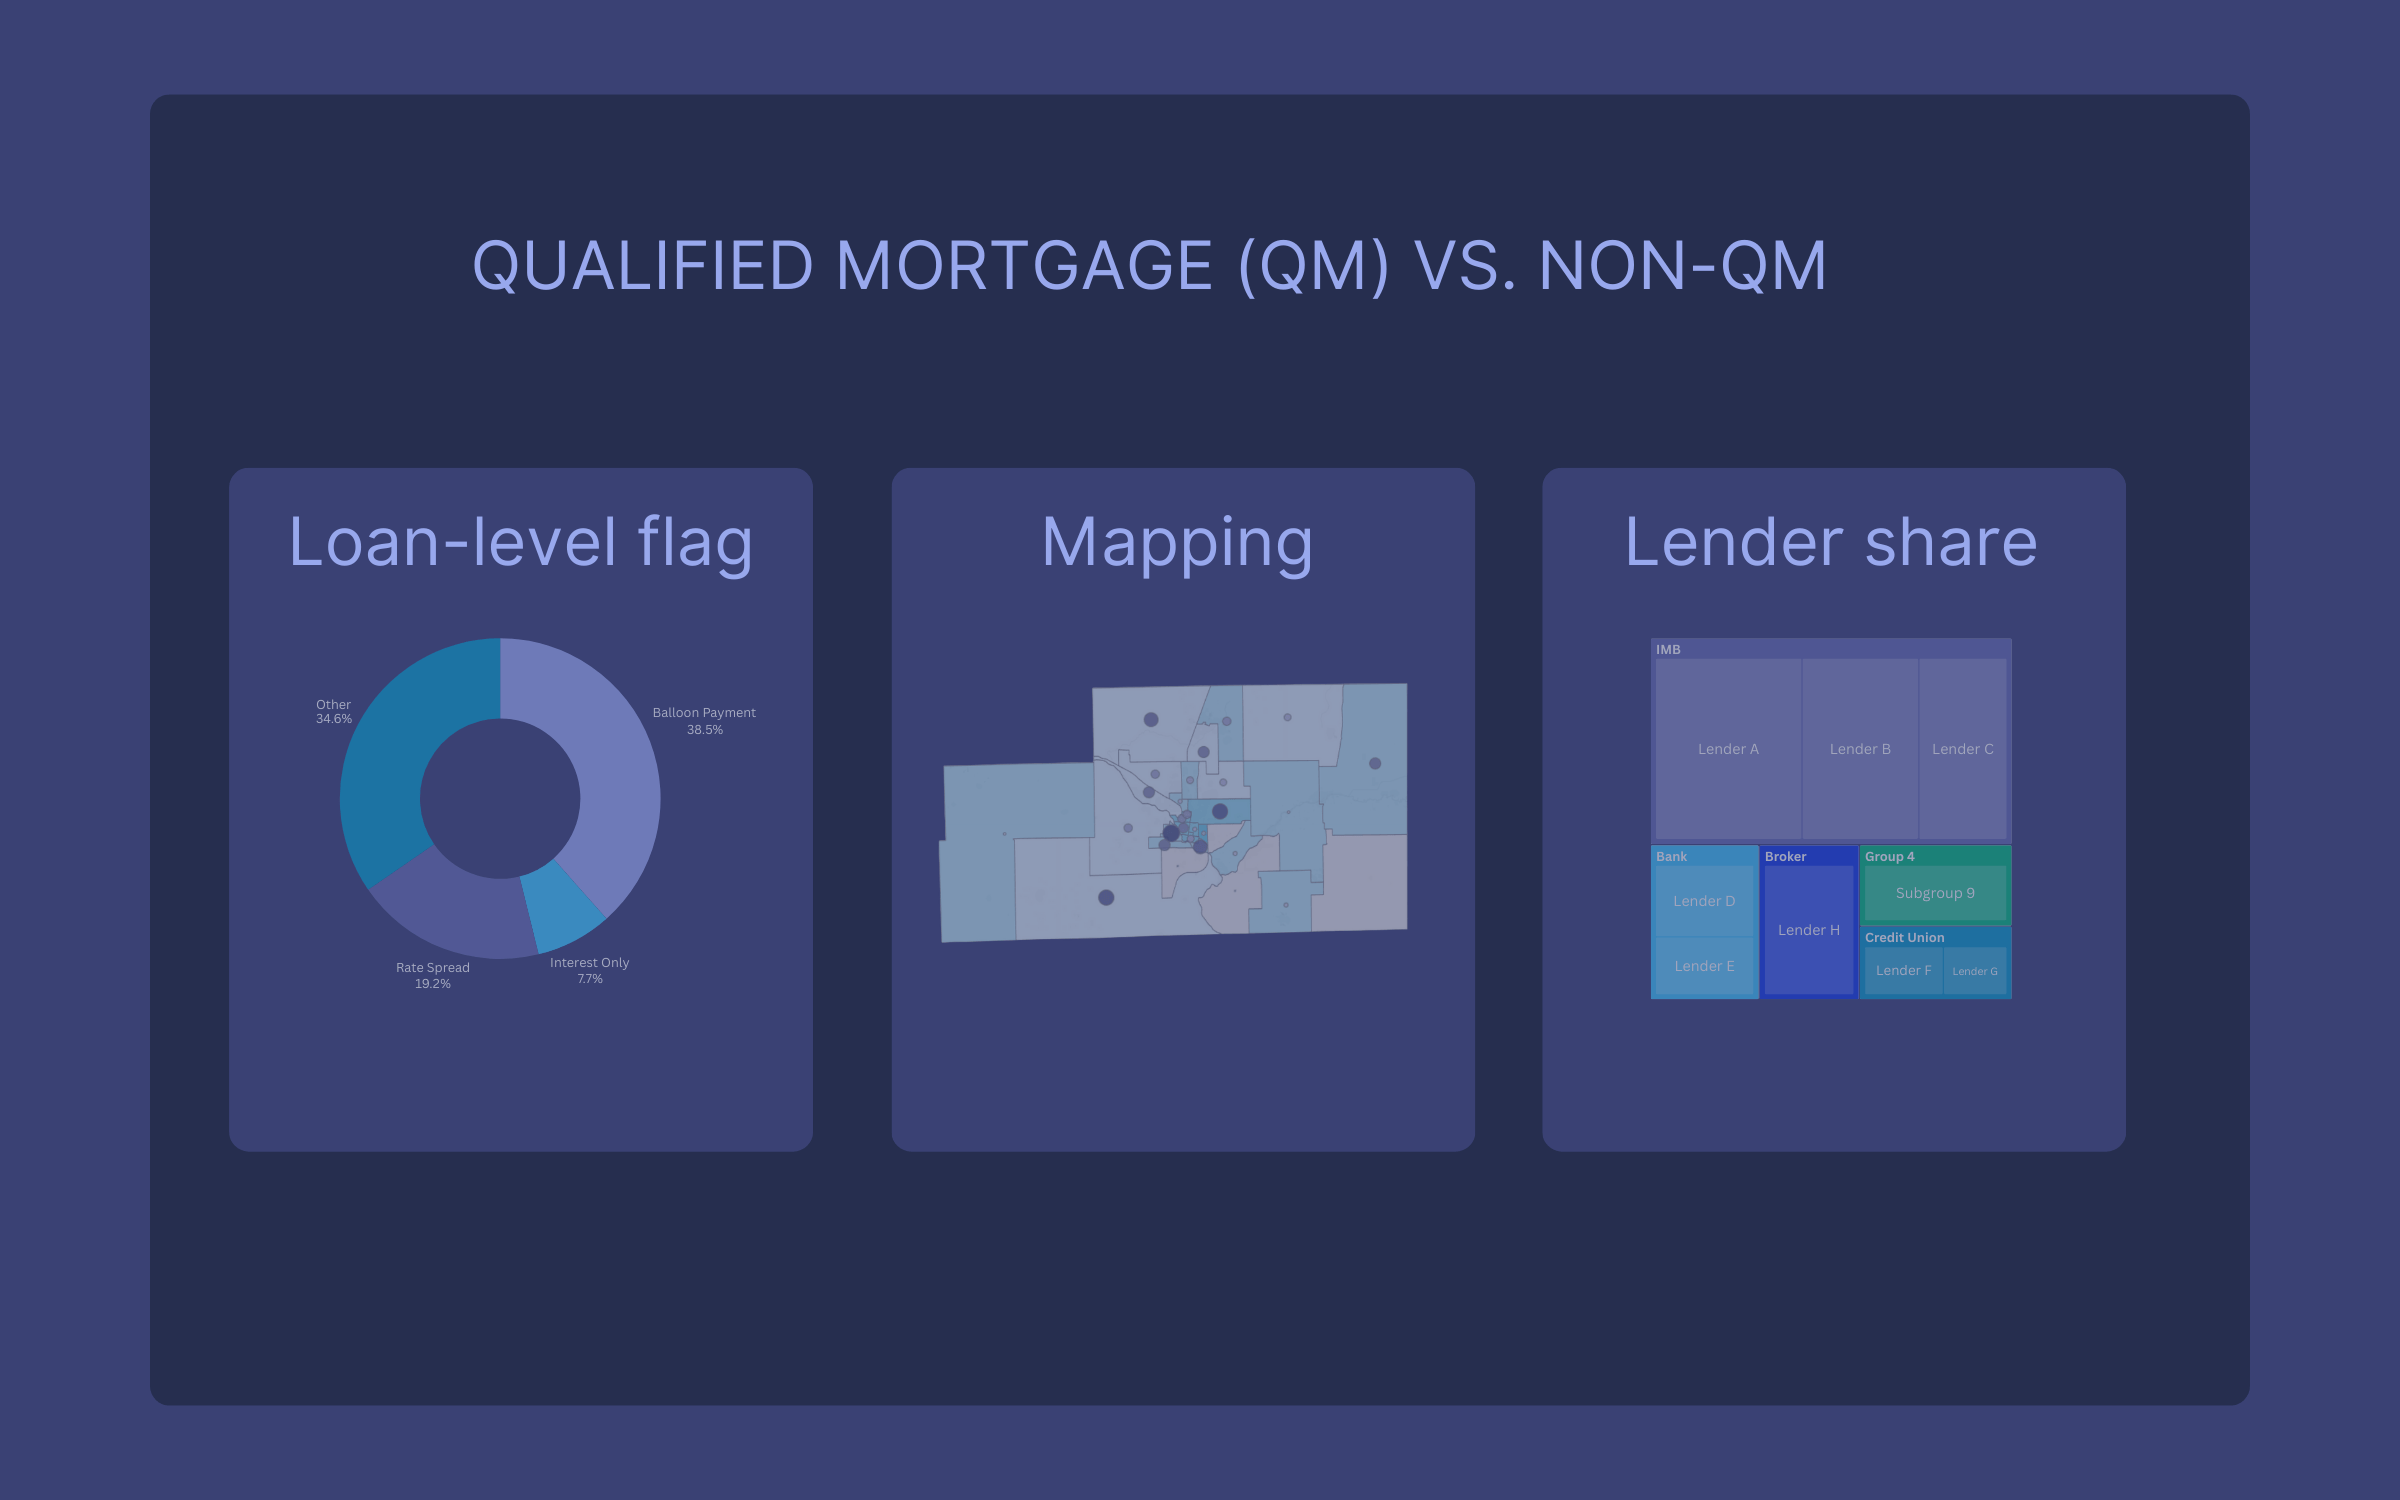
Non-QM Markets
Using the actual ATR/QM rule logic and year-specific thresholds, you can finally track the non-QM market by lender, product, channel, geography, and borrower segment - not just in headlines or securitization decks.
Understand Non-QM Features
Instantly see if a loan triggered Non-QM status due to pricing (rate spread), product features (IO/Balloon), or points and fees.
Map Opportunity and Risk
Overlay Non-QM lending patterns on census tracts, income categories, and demographic data to identify underserved markets.

Build borrower profiles to focus market outreach
Borrowers have different needs at different stages of life. First-time home vs. Repeat home buyers. Meet your borrowers where they are.
Anticipate market shifts and find the pattern
Go beyond averages to spot emerging borrower patterns and align your strategy for future success.
Strategically focus your outreach
Leverage advanced filters to understand diverse borrower characteristics, enabling tailored communication and efficient resource allocation.

Pinpoint opportunities & grow partnerships
Empower LOs with hyper-local market maps to identify prime areas and foster stronger real estate connections.
Build authority & expertise
Transform LOs into trusted advisors with irrefutable, data-backed insights from HMDAVision, eliminating guesswork.
Streamline presentations & save resources
Deliver instant, presentation-ready market insights, equipping LOs without the need for extensive data science teams.

Mortgage originations map by MMCT
Instantly scan your market for any gaps in originations by mapping and calculating the results simultaneously. Avoid redlining risk.
Scan for underwriting risk
Instantly compare approval and denial rate between protected groups and non-protected class to spot any disparities. Understand how your result compares to market and peers.
Scan for other fair lending risks
Map your originations or applications by area demographics and analyze your competitors patterns. Find opportunities in underserved markets.