HMDAVISION
What happened in lending
Applications, originations, lenders, products, pricing, channels, borrower characteristics, and geographic coverage.
CENSUSVISION · A COMMUNITY INTELLIGENCE LENS INSIDE POLYGON VISION
CensusVision shows the households, renters, homeowners, movers, incomes, housing costs, languages, and life stages behind local housing demand.
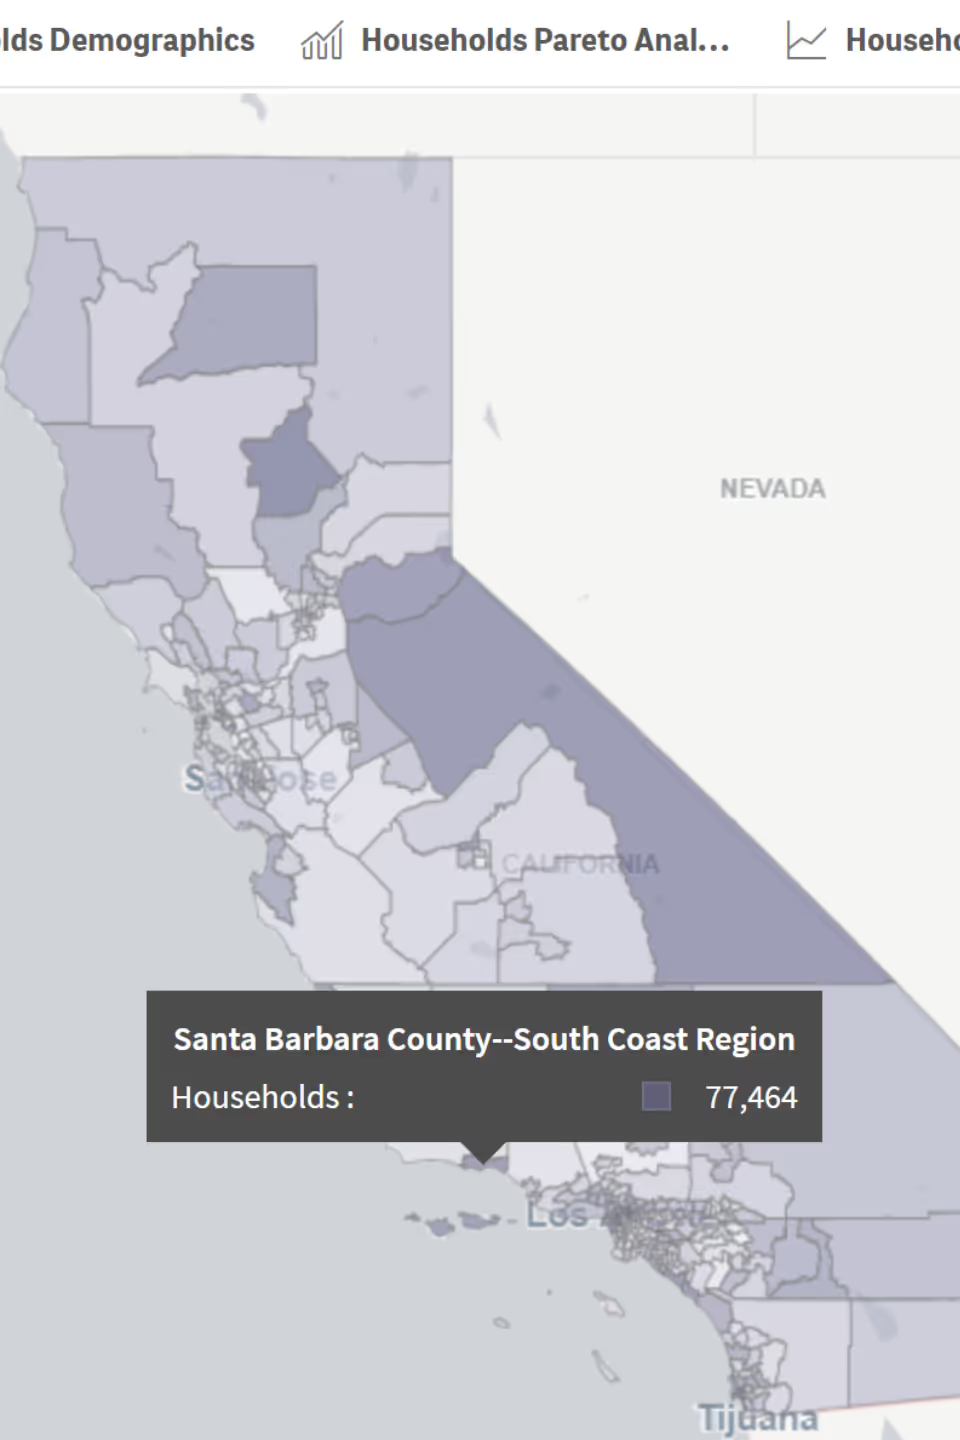
Use it to size opportunity and compare community potential with mortgage activity in HMDAVision.
THE MISSING DENOMINATOR
Mortgage teams often plan from production data alone. That leaves an important question unanswered: how does the market being served compare with the people and households who actually live there?
HMDAVISION
Applications, originations, lenders, products, pricing, channels, borrower characteristics, and geographic coverage.
CENSUSVISION
Households, renters and owners, income, housing costs, migration, language, age, occupation, veteran status, and life stage.
Together, HMDAVision and CensusVision reveal where mortgage activity aligns with the underlying community, where it diverges, and where deeper analysis should begin.
FIVE MORTGAGE DECISIONS
CensusVision is most useful when the business question is specific. These are the kinds of decisions mortgage strategy, production, marketing, affordable lending, and community development teams can examine.
Strategic question
Evidence CensusVision contributes
Decision it informs
Is this market large enough for our growth plan?
Household counts, tenure, income, age, movers, household formation, housing costs, and relevant population segments.
Enter, prioritize, staff, or defer the market.
Which borrower and product strategy fits here?
Renters and owners by life stage, veteran status, income, cost burden, household composition, and housing characteristics.
Shape first-time buyer, affordable, VA, education, or other local strategies.
Are we reaching the market that actually exists?
Community composition in CensusVision compared with applications, originations, products, and geographic coverage in HMDAVision.
Focus market-coverage review, partnerships, and outreach.
Where may housing demand be forming next?
Recent movers, relocation patterns, household formation, age, occupation, employment, and changing housing needs.
Inform loan-officer placement, partnerships, content, and channel strategy.
What stands between local renters and ownership?
Rent, income, owner costs, taxes, insurance, utilities, property type, household structure, and cost burden.
Test education, down-payment support, affordable products, and nonprofit or builder relationships.
ONE EXAMPLE
Atlanta had 307,262 households move into or within the metro, the broad addressable housing opportunity. In 2025, lenders received 116,847 purchase-mortgage applications, the clearest measure of expressed mortgage demand. Of those applications, 76,110 became funded purchase loans. Broker-channel share rose from 18% in 2021 to 26% in 2025, showing that more buyers chose brokers to help finance their purchase.
307,262
mover households
116,847
purchase-mortgage applications
76,110
funded purchase loans
18% → 26%
broker-channel share, 2021 to 2025
How large is the opportunity? How much demand reaches a lender? How much converts to funded loans? Which channels are buyers choosing?
BUILD THE RIGHT MARKET DEFINITION
Combine people, housing, affordability, and movement data to see which households shape the opportunity, then compare that potential with mortgage activity.
People and households
Age, income, household composition, language, occupation, race and ethnicity, veteran status, disability, nativity, and citizenship.
Housing and affordability
Tenure, housing type, rent, mortgage costs, taxes, insurance, utilities, and housing cost burden.
Movement and life stage
Recent movers, relocation, household formation, housing need, and first-time versus repeat-buyer context.
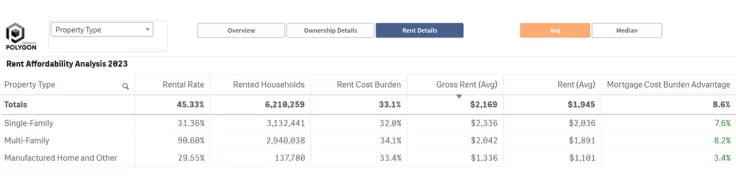
CensusVision provides community and household context; HMDAVision provides mortgage applications and originations. Polygon Vision connects the two analytical lenses while keeping the underlying data distinct.
USED IN PRACTICE
“We used CensusVision to understand local demographics and homeownership gaps in order to identify underserved communities and strategically target outreach.”
Cristian Correa
SVP, National Diversity Lending
CENSUSVISION FAQ
CensusVision is the community intelligence application inside Polygon Vision. It makes American Community Survey person, household, housing, affordability, and migration data practical for housing-finance analysis.
Teams use it to size markets, define borrower and product opportunities, understand affordability, examine household movement, compare community potential with mortgage activity, and focus outreach or partnership strategies.
HMDAVision analyzes mortgage applications, originations, lenders, products, pricing, and outcomes. CensusVision analyzes the people, households, and housing conditions around that mortgage activity. They are separate analytical lenses inside Polygon Vision.
No. CensusVision is a market and community analysis application. It sizes and compares population segments; it is not a consumer lead list, credit decision tool, or determination of individual mortgage eligibility.
CensusVision can provide community context for market-coverage, outreach, and program analysis. Used with HMDAVision, it can help teams identify patterns and focus deeper review. It does not replace legal or compliance judgment.
CensusVision is built on U.S. Census Bureau American Community Survey data. Polygon Research organizes person, household, housing, affordability, and community measures for interactive analysis and comparison.
BRING A MARKET YOU ARE EVALUATING
Start with a county, metro, borrower strategy, or market-coverage question. A guided trial lets your team examine it using both CensusVision and HMDAVision.
