Agency Rate-Term Refi Average LTV by State: TTM January 2026

Loan Pricing
Dashboard-style U.S. map titled “Average LTV by State” showing trailing 12-month agency rate-and-term refinance data (January 2026). Choropleth map displays average loan-to-value ratios by state, color-coded by leverage tiers (High >80%, Upper 76–80%, Lowe
Chart Download and Page Share

Share or Download

Data Points
State Name Alaska Guam Virginia Oklahoma Louisiana Alabama Maryland North Dakota Mississippi New Mexico Texas Nevada West Virginia Kansas South Carolina North Carolina Georgia Arkansas Florida Indiana Hawaii Ohio Kentucky Missouri Arizona Wyoming Delaware Nebraska Tennessee Minnesota Oregon Pennsylvania Iowa Colorado Michigan Washington South Dakota Maine Utah Illinois Connecticut Idaho Wisconsin New Hampshire District of Columbia Rhode Island Montana California Vermont New Jersey Massachusetts New York Puerto Rico Virgin Islands of the U.S. Trailing 12 Months 1,313 31 28,009 8,666 7,689 14,250 16,096 1,128 5,974 4,975 46,119 8,510 2,982 6,128 17,610 36,522 34,286 8,010 42,115 19,871 1,657 28,505 11,204 18,645 23,161 1,996 3,197 4,729 23,755 11,359 9,413 21,225 5,986 19,759 26,447 20,896 1,908 3,476 10,205 27,287 5,922 5,242 14,178 4,026 737 2,338 3,054 59,010 909 17,913 11,862 10,054 551 8 Avg LTV 85% 82% 81% 81% 81% 81% 81% 81% 81% 80% 80% 80% 80% 80% 80% 79% 79% 79% 79% 79% 79% 79% 79% 78% 78% 78% 78% 78% 77% 77% 77% 77% 77% 76% 76% 76% 76% 76% 76% 76% 75% 75% 75% 74% 74% 74% 73% 73% 73% 72% 71% 71% 69% 60%
Date Published:
February 20, 2026
Date Updated:
February 20, 2026
Chart type:
Map
Suggested Citation:
Polygon Research. “Average LTV by State – Agency Rate & Term Refinance (Trailing 12 Months, January 2026).” Polygon Pulse – MBS Pivot. Published February 20, 2026. Scope: Agency rate-term refinance originations; trailing 12 months; state-level averages; excludes U.S. territories; includes loan count and average LTV. Total Loans: 769,421.
Key Insight and Commentary

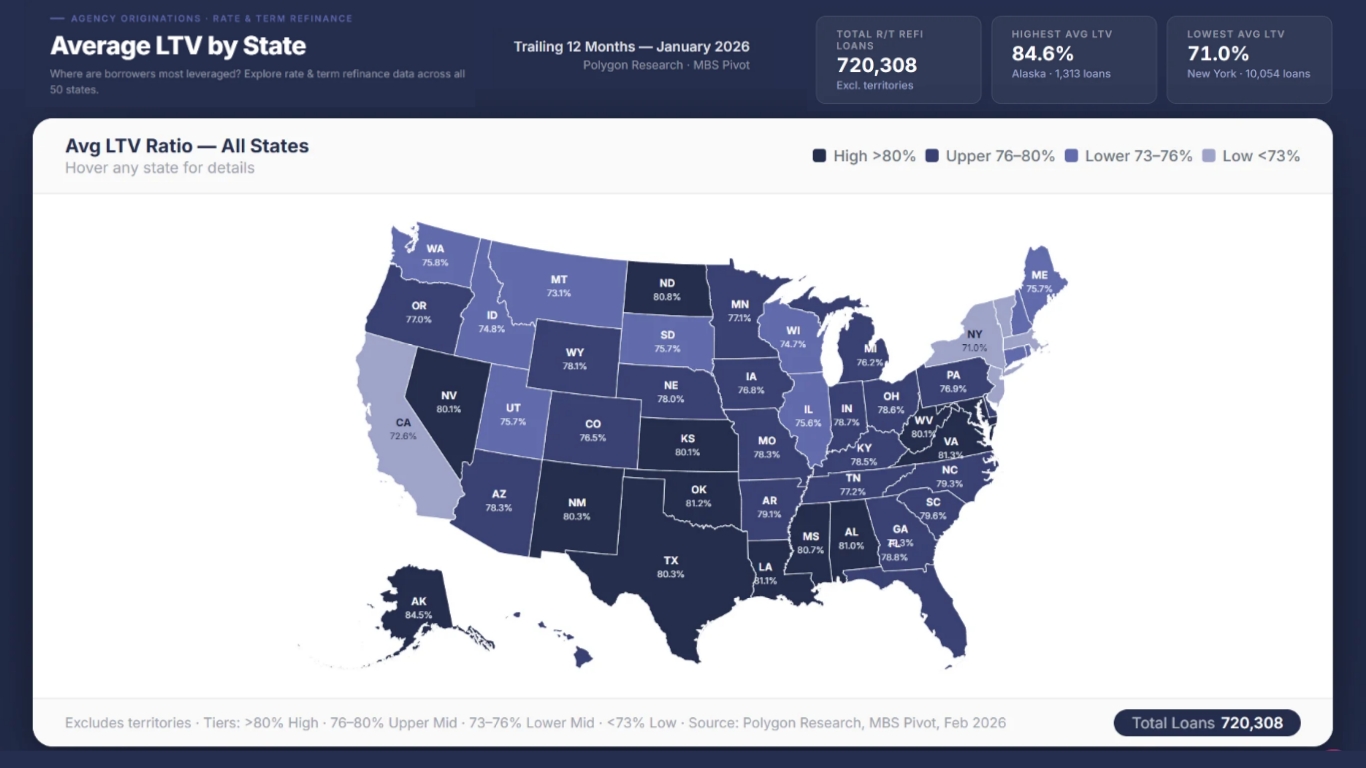
This map presents trailing 12-month (TTM) average LTV for agency rate-and-term refinances through January 2026 . Several states exceed 80% average LTV—including Alaska (84.5%), Virginia (81.3%), Oklahoma (81.2%), and Louisiana (81.1%)—indicating thinner borrower equity cushions in recent refi activity. In contrast, large production states such as California (72.6%), Florida (78.8%), and Texas (80.3%) show more moderate profiles relative to some smaller markets.

For lenders, this dispersion matters operationally and financially. Higher average LTV increases exposure to collateral volatility, MI reliance, and potential repurchase sensitivity, particularly if home price appreciation moderates. Secondary marketing teams should assess whether geographic concentration at elevated LTVs is aligned with hedge coverage, SRP execution, and capital allocation. Servicing leaders should also evaluate prepayment and default sensitivity in high-LTV cohorts, as thinner equity can amplify both refi incentives (if rates fall) and credit stress (if prices soften).

Strategically, this data supports tighter appraisal QC in high-LTV geographies and enhanced monitoring of state-level house price trends.

From Analysis to Action

This analysis provides a clear blueprint for how to uncover meaningful market dynamics. Its true power is unleashed when you apply this same methodology to your own local markets. Because all real estate is local, this granular approach is essential for crafting precise strategies that effectively address the unique conditions of each community.

Ready to Continue? Get Your Exact Market Answers.

Go beyond generic insights. Polygon's interactive tools and limitless filtering empower you to tailor market data to your specific strategy.
Start your 7-day free trial.
Unlock My Custom Insights Now - Free Trial