DC Zipcode Refinance Incentive Ratios

Origination Trends
Chart Download and Page Share

Share or Download

Data Points

ZCTA  Originations  (Count of Loans)  Loan Volume  (Mil)  Loan Size ($)  CLTV  Interest Rate  Refinance Ratio (as of August  2025*)    20002  446  $275.69  $618,139  83.38%  7.138%  1.10    20011  350  $213.65  $610,429  82.72%  7.325%  1.13    20009  286  $159.93  $559,196  78.14%  7.06%  1.09    20019  223  $86.28  $386,883  92.91%  7.638%  1.18    20001  198  $128.25  $647,727  80.26%  7.12%  1.10    20007  155  $132.66  $855,839  74.90%  7.05%  1.08    20003  152  $109.73  $721,908  78.73%  7.069%  1.09    20010  145  $93.69  $646,103  79.10%  7.125%  1.10    20017  132  $78.02  $591,061  85.11%  7.071%  1.09    20020  129  $49.37  $382,674  92.61%  7.49%  1.15    20016  127  $102.10  $803,898  74.42%  7.126%  1.10    20008  123  $93.12  $757,114  74.12%  7.054%  1.09

Date Published:
August 25, 2025
Date Updated:
August 25, 2025
Chart type:
Table
Suggested Citation:
Polygon Research. "District of Columbia - 2024 Purchase Mortgage Originations (6.5%+), 1-4 Units & Refi Incentive." Polygon Vision – HMDAVision. August 2025. Filters: Home Purchase, 1-4 Units, >=6.5%, 2024
Key Insight and Commentary

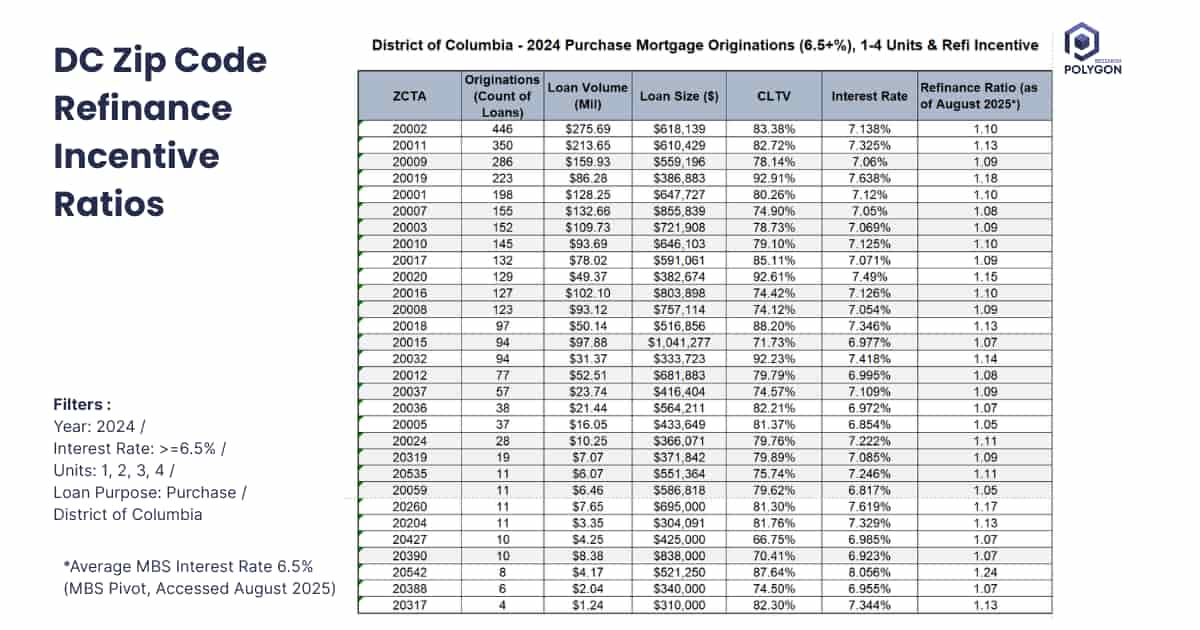
Mortgage lending is hyperlocal, varying significantly neighborhood to neighborhood. Using HMDA 2024 data (in HMDAVision) filtered for loans ≥6.5% vs. average (2025YTD) MBS rate of 6.5%, refinance incentive ratios across DC zip codes range from 1.05 to 1.24.

High-ratio areas like 20542 (1.24 ratio, 87.64% CLTV) show strong rate motivation but limited equity for traditional refinancing, requiring specialized high-LTV products.

Optimal strategy targets moderate-ratio, high-volume zones (20002: 1.10 ratio, 446 loans, 83.38% CLTV) where meaningful rate savings combine with adequate equity for streamlined approvals.

Low-ratio areas (20005, 20059) with sub-82% CLTVs represent premium borrowers ideal for relationship-based retention campaigns.

Lenders should stratify marketing by both incentive ratio and equity position, avoiding high-cost acquisition in equity-constrained markets while maximizing conversion in the sweet spot of motivated, qualified borrowers.

This hyperlocal intelligence enables precision marketing allocation, optimized territories, and data-driven advertising in the post-trigger-lead landscape.

From Analysis to Action

This analysis provides a clear blueprint for how to uncover meaningful market dynamics. Its true power is unleashed when you apply this same methodology to your own local markets. Because all real estate is local, this granular approach is essential for crafting precise strategies that effectively address the unique conditions of each community.

Ready to Continue? Get Your Exact Market Answers.

Go beyond generic insights. Polygon's interactive tools and limitless filtering empower you to tailor market data to your specific strategy.
Start your 7-day free trial.
Unlock My Custom Insights Now - Free Trial