FHA Lending 2025: Monthly Market Data & Trends
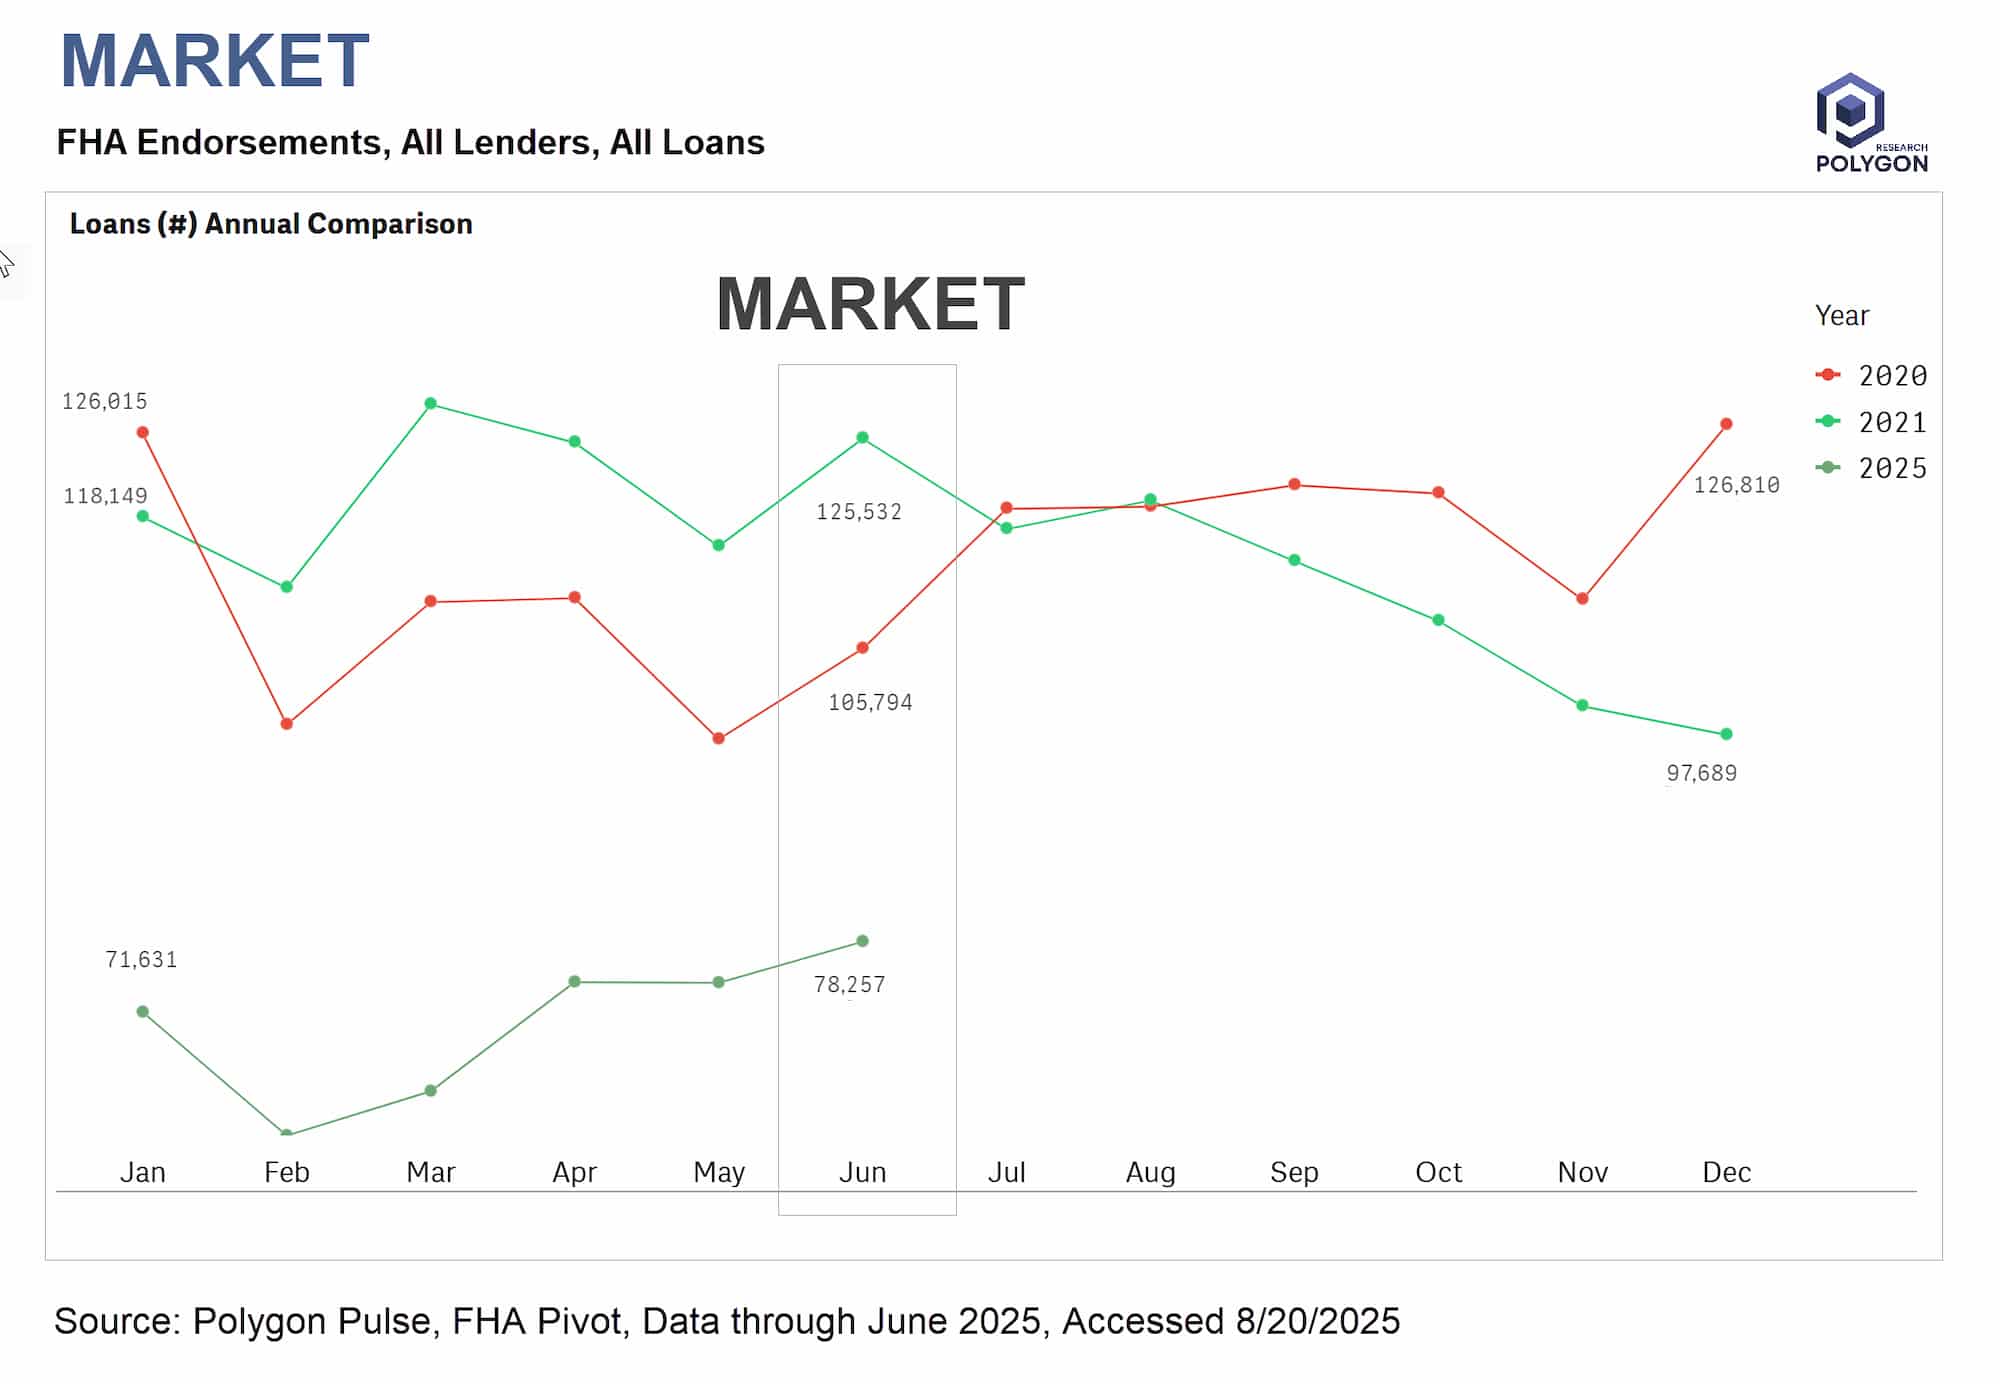
The monthly FHA endorsement comparison shows 2025 volumes climbing steadily from 71,631 to 78,257 loans through June, still below boom years but consistently narrowing the gap.
This data matters because FHA serves as the market's leading indicator for first-time homebuyer demand.
Many banks and credit unions remain underweight in FHA, viewing it as operationally complex, or risky. This institutional hesitation creates competitive advantage for lenders who recognize FHA's strategic value.
Strong FHA presence builds lasting customer relationships at the critical first purchase, positioning lenders for decades of repeat business, refinances, and wealth-building products.
The steady 2025 trajectory, unlike the volatile boom years, indicates sustainable first-time buyer activity despite affordability challenges.
For strategic planning, this chart reveals whether the purchase market foundation is strengthening. Lenders using this monthly data understand that today's FHA borrower is tomorrow's conventional customer. Those who dismiss FHA miss not just immediate volume but the opportunity to capture customers at the beginning of their homeownership journey.
From Analysis to Action
Ready to Continue? Get Your Exact Market Answers.
Start your 7-day free trial.