Latest Credit Union Delinquency Trends: Q2 2025

Credit Unions
Latest credit union delinquency trends
Chart Download and Page Share

Share or Download

Data Points

quarter  1st & 2nd Lien portfolio  loan count  1st&2nd Lien  Status_60_and_up_DLQ_count_pct    Q2 2025                                  6,698,205   0.654%    Q1 2025                                  6,604,742   0.498%    Q4 2024                                  6,565,879   0.705%    Q3 2024                                  6,493,814   0.635%    Q2 2024                       6,398,983   0.572%    Q1 2024                                  6,306,742   0.475%    Q4 2023                                  6,242,816   0.558%

Date Published:
October 2, 2025
Date Updated:
October 2, 2025
Chart type:
Line Chart
Suggested Citation:
Polygon Research, "Credit Unions - 60+ DLQ Trend," October 2025. Data retrieved from NCUA Call Reports for Q4 2023-Q2 2025. Scope: Total Portfolio Loan Count and 60+ Day Delinquency Percentage.
Key Insight and Commentary

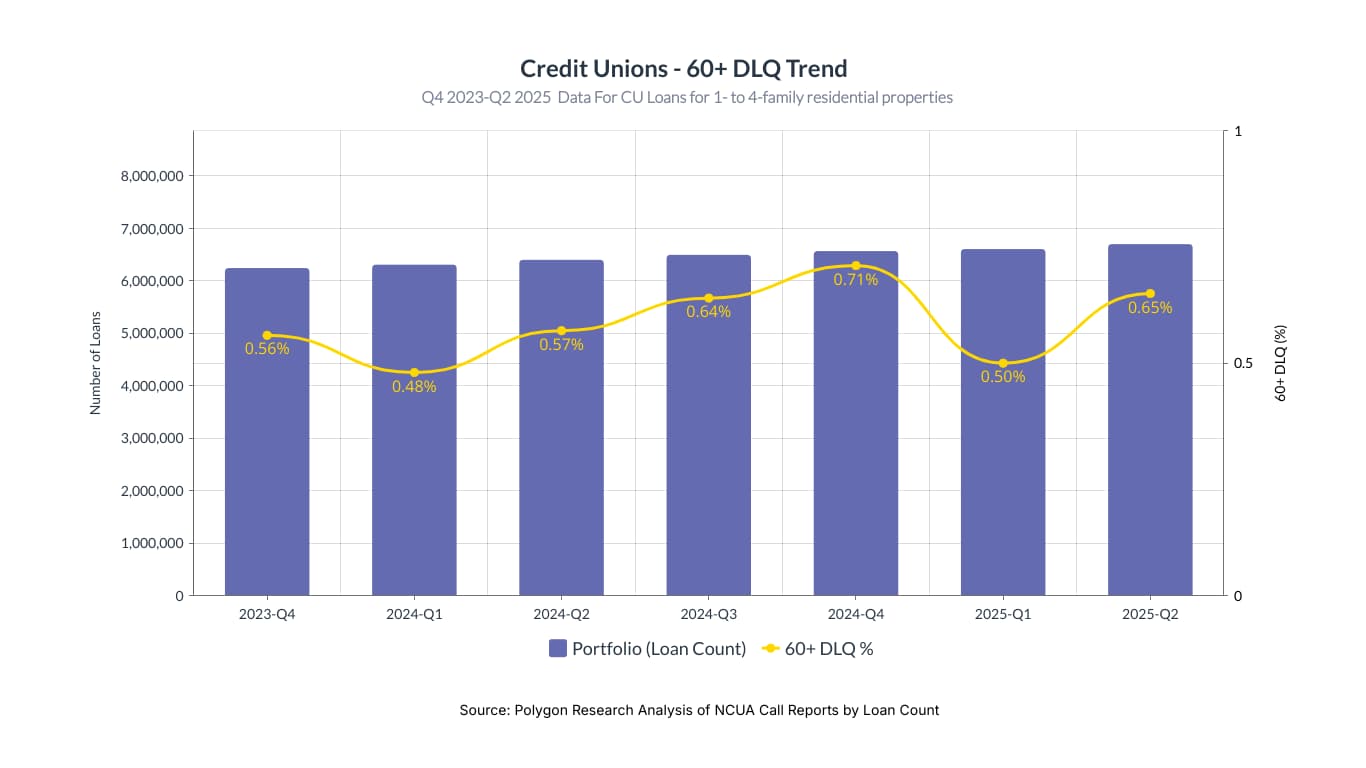
Credit union 60+ day delinquencies (by loan count) show a pattern of seasonal volatility, with year-end peaks and first-quarter troughs.

The spike in Q2 2025 continues this trend and signals a potential increase in portfolio credit risk and an early warning of growing financial stress among the member base.

Understanding this rhythm is helpful for proactive risk management. Credit union leaders can anticipate higher delinquencies toward year-end and adjust collections and loss mitigation strategies, for instance, by increasing member outreach in Q3 and Q4.

The Q2 2025 spike should prompt an immediate review of loan loss reserves and capital adequacy to ensure preparedness for a continued upward trend.

These insights also provide valuable macro-level context for re-evaluating underwriting standards and product features. By benchmarking their own performance against these national trends distilled from NCUA Call Reports, credit unions can better assess their relative risk exposure and the effectiveness of their member support strategies.

From Analysis to Action

This analysis provides a clear blueprint for how to uncover meaningful market dynamics. Its true power is unleashed when you apply this same methodology to your own local markets. Because all real estate is local, this granular approach is essential for crafting precise strategies that effectively address the unique conditions of each community.

Ready to Continue? Get Your Exact Market Answers.

Go beyond generic insights. Polygon's interactive tools and limitless filtering empower you to tailor market data to your specific strategy.
Start your 7-day free trial.
Unlock My Custom Insights Now - Free Trial