Military & Veteran Homeownership by Generation: A Market Analysis
Data Points
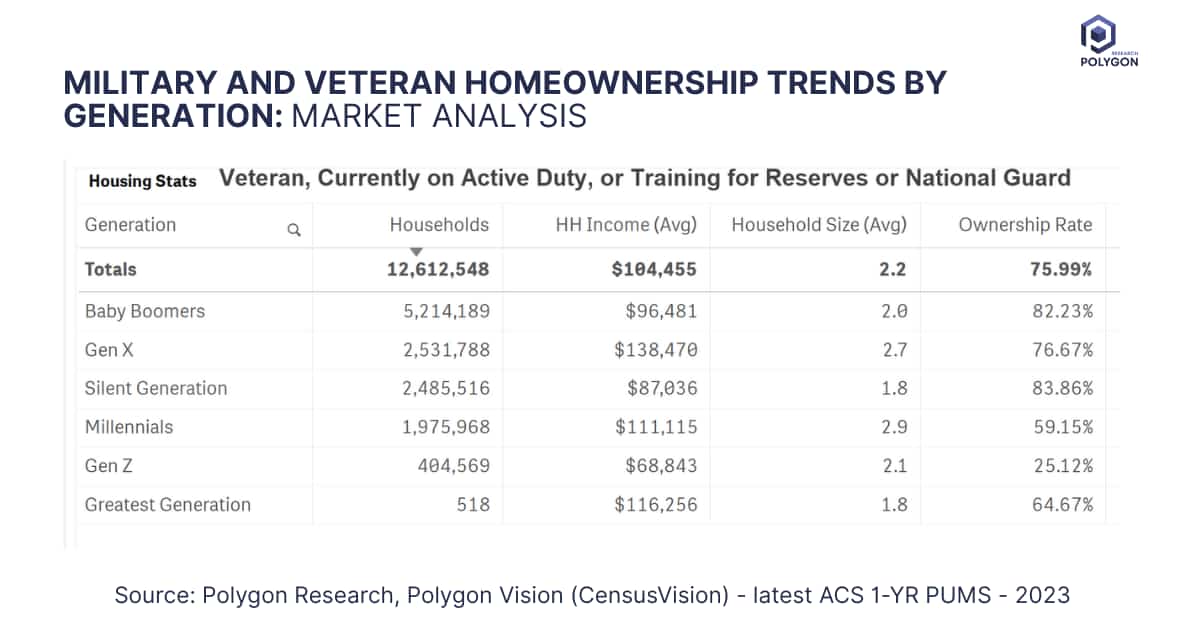
Generation Households HH Income (Avg) Household Size (Avg) Ownership Rate Baby Boomers 5,214,189 $96,481 2.0 82.23% Gen X 2,531,788 $138,470 2.7 76.67% Silent Generation 2,485,516 $87,036 1.8 83.86% Millennials 1,975,968 $111,115 2.9 59.15% Gen Z 404,569 $68,843 2.1 25.12% Greatest Generation 518 $116,256 1.8 64.67%
Do younger veterans have lower homeownership rates?
Date Published:
August 6, 2025
Date Updated:
August 7, 2025
Chart type:
Table
Suggested Citation:
Polygon Research, "Analysis by Generation of Head of Household - Veteran, Currently on Active Duty or Training for Reserves or National Guard," Polygon Vision (CensusVision), accessed August 7, 2025, Data Source: latest ACS 1-YR PUMS - 2023 (via IPUMS)
Key insights
This is a generational analysis of military households (active duty, reserves/guard, and veterans) highlights a key lifecycle trend: while older generations like Baby Boomers have homeownership rates over 82%, a major opportunity exists with younger cohorts.
The data is highly actionable for lenders.
- The largest cohort consist of 5.2+ million Baby Boomers, followed by Gen X with over 2.5 million.
- Nearly 2 million Millennial military households, despite a strong average income of $111,115, have an ownership rate of just 59.15%.
- This gap signals a need for targeted outreach, especially education on the VA Loan's powerful no/low down payment benefits. Their larger household size (2.9) also informs product suitability.
- For emerging Gen Z members, early engagement via financial literacy can build a long-term customer pipeline. By tailoring products to these underserved generations, lenders can tap into a loyal, financially capable market.
Methodology Note: Generations are defined by Pew Research: Greatest (1901-27), Silent (1928-45), Boomers (1946-64), Gen X (1965-80), Millennials (1981-96), Gen Z (1997-2012).
From Analysis to Action
This analysis provides a clear blueprint for how to uncover meaningful market dynamics. Its true power is unleashed when you apply this same methodology to your own local markets. Because all real estate is local, this granular approach is essential for crafting precise strategies that effectively address the unique conditions of each community.
Ready to Continue? Get Your Exact Market Answers.
Go beyond generic insights. Polygon's interactive tools and limitless filtering empower you to tailor market data to your specific strategy.
Start your 7-day free trial.
Start your 7-day free trial.