Mississippi Mortgage Marketing Gap 2024: HMDA Applications vs Demographics Mix
Data Points
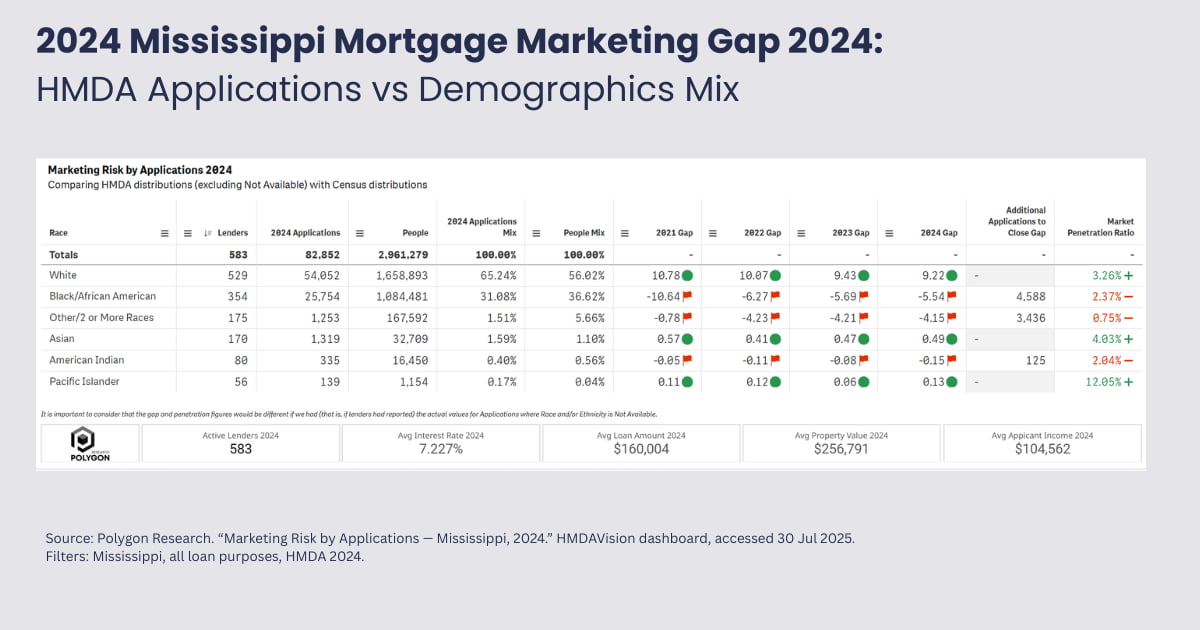
Race Lenders 2024 Applications People 2024 Applications Mix People Mix 2024 Gap Additional Applications to Close Gap Market Penetration Ratio White 529 54,052 1,658,893 65.24% 56.02% 9.22 - 3.26% Black/African American 354 25,754 1,084,481 31.08% 36.62% -5.54 4,588 2.37% Other/2 or More Races 175 1,253 167,592 1.51% 5.66% -4.15 3,436 0.75% Asian 170 1,319 32,709 1.59% 1.10% 0.49 - 4.03% American Indian 80 335 16,450 0.40% 0.56% -0.15 125 2.04% Pacific Islander 56 139 1,154 0.17% 0.04% 0.13 - 12.05%
Is there a gap in mortgage applications for Black home buyers in Mississippi?
Date Published:
July 29, 2025
Date Updated:
July 30, 2025
Chart type:
Table
Suggested Citation:
Polygon Research. “Marketing Risk by Applications — Mississippi, 2024.” HMDAVision dashboard, accessed 30 Jul 2025. Filters: Mississippi, all loan purposes, owner-occupied, HMDA 2024. Key metrics: Active lenders = 583; Total apps = 82,852; White gap = +9.22 pp; Black gap = -5.54 pp; Additional Black apps to parity = 4,588.
Key insights
This table compares 82,852 HMDA mortgage applications in 2024 from 583 MS lenders with the state’s 2.96 million residents. “Gap” shows the spread between each race’s share of apps and its Census share (green = over-penetration, red = shortfall).
- White – 56 % of pop. vs 65 % of apps (+9.22 pp); 3.26 % penetration suggests saturation.
- Black/African-American – 36.6 % pop. vs 31.1 % apps (-5.54 pp). Roughly 4,588 more apps would close the gap—biggest growth lane.
- Other/Two-or-More Races – -4.15 pp (≈3,400 apps).
- Asian +0.49 pp and Pacific Islander(slight surplus)
- American Indian – -0.15 pp (small shortfall).
Strategic takeaway
Re-direct marketing digital ads, faith-based partnerships, realtor training - into areas with Black and multiracial households. Closing these gaps simultaneously reduces fair-lending risk and adds production in a margin-compressed market.
From Analysis to Action
This analysis provides a clear blueprint for how to uncover meaningful market dynamics. Its true power is unleashed when you apply this same methodology to your own local markets. Because all real estate is local, this granular approach is essential for crafting precise strategies that effectively address the unique conditions of each community.
Ready to Continue? Get Your Exact Market Answers.
Go beyond generic insights. Polygon's interactive tools and limitless filtering empower you to tailor market data to your specific strategy.
Start your 7-day free trial.
Start your 7-day free trial.