Monthly Mortgage Rate Trends from 2022 to 2025

Origination Trends
Combo chart showing monthly trends from January 2022 through October 2025. January peak of volume (lowest rate), November 2023 peak of interest rate, and Current interest rate in October 2025.
Chart Download and Page Share

Share or Download

Data Points
Month Jan 2022 Feb 2022 Mar 2022 Apr 2022 May 2022 Jun 2022 Jul 2022 Aug 2022 Sep 2022 Oct 2022 Nov 2022 Dec 2022 Jan 2023 Feb 2023 Mar 2023 Apr 2023 May 2023 Jun 2023 Jul 2023 Aug 2023 Sep 2023 Oct 2023 Nov 2023 Dec 2023 Jan 2024 Feb 2024 Mar 2024 Apr 2024 May 2024 Jun 2024 Jul 2024 Aug 2024 Sep 2024 Oct 2024 Nov 2024 Dec 2024 Jan 2025 Feb 2025 Mar 2025 Apr 2025 May 2025 Jun 2025 Jul 2025 Aug 2025 Sep 2025 Oct 2025 Avg Rate 3.20% 3.50% 3.86% 4.31% 4.91% 5.23% 5.46% 5.42% 5.45% 5.99% 6.52% 6.43% 6.25% 6.08% 6.28% 6.30% 6.27% 6.42% 6.57% 6.71% 6.90% 7.08% 7.29% 7.02% 6.58% 6.46% 6.61% 6.67% 6.85% 6.79% 6.70% 6.47% 6.15% 5.98% 6.27% 6.44% 6.53% 6.61% 6.48% 6.40% 6.48% 6.57% 6.53% 6.43% 6.23% 6.14%
Date Published:
November 21, 2025
Date Updated:
November 21, 2025
Chart type:
Combo Chart
Suggested Citation:
Polygon Research. “Monthly Mortgage Rate Trends from 2022 to 2025.” Polygon Pulse - MBS Pivot. Accessed November 2025. National average mortgage rates and count of loans, by month, 2022–2025.
Key Insight and Commentary

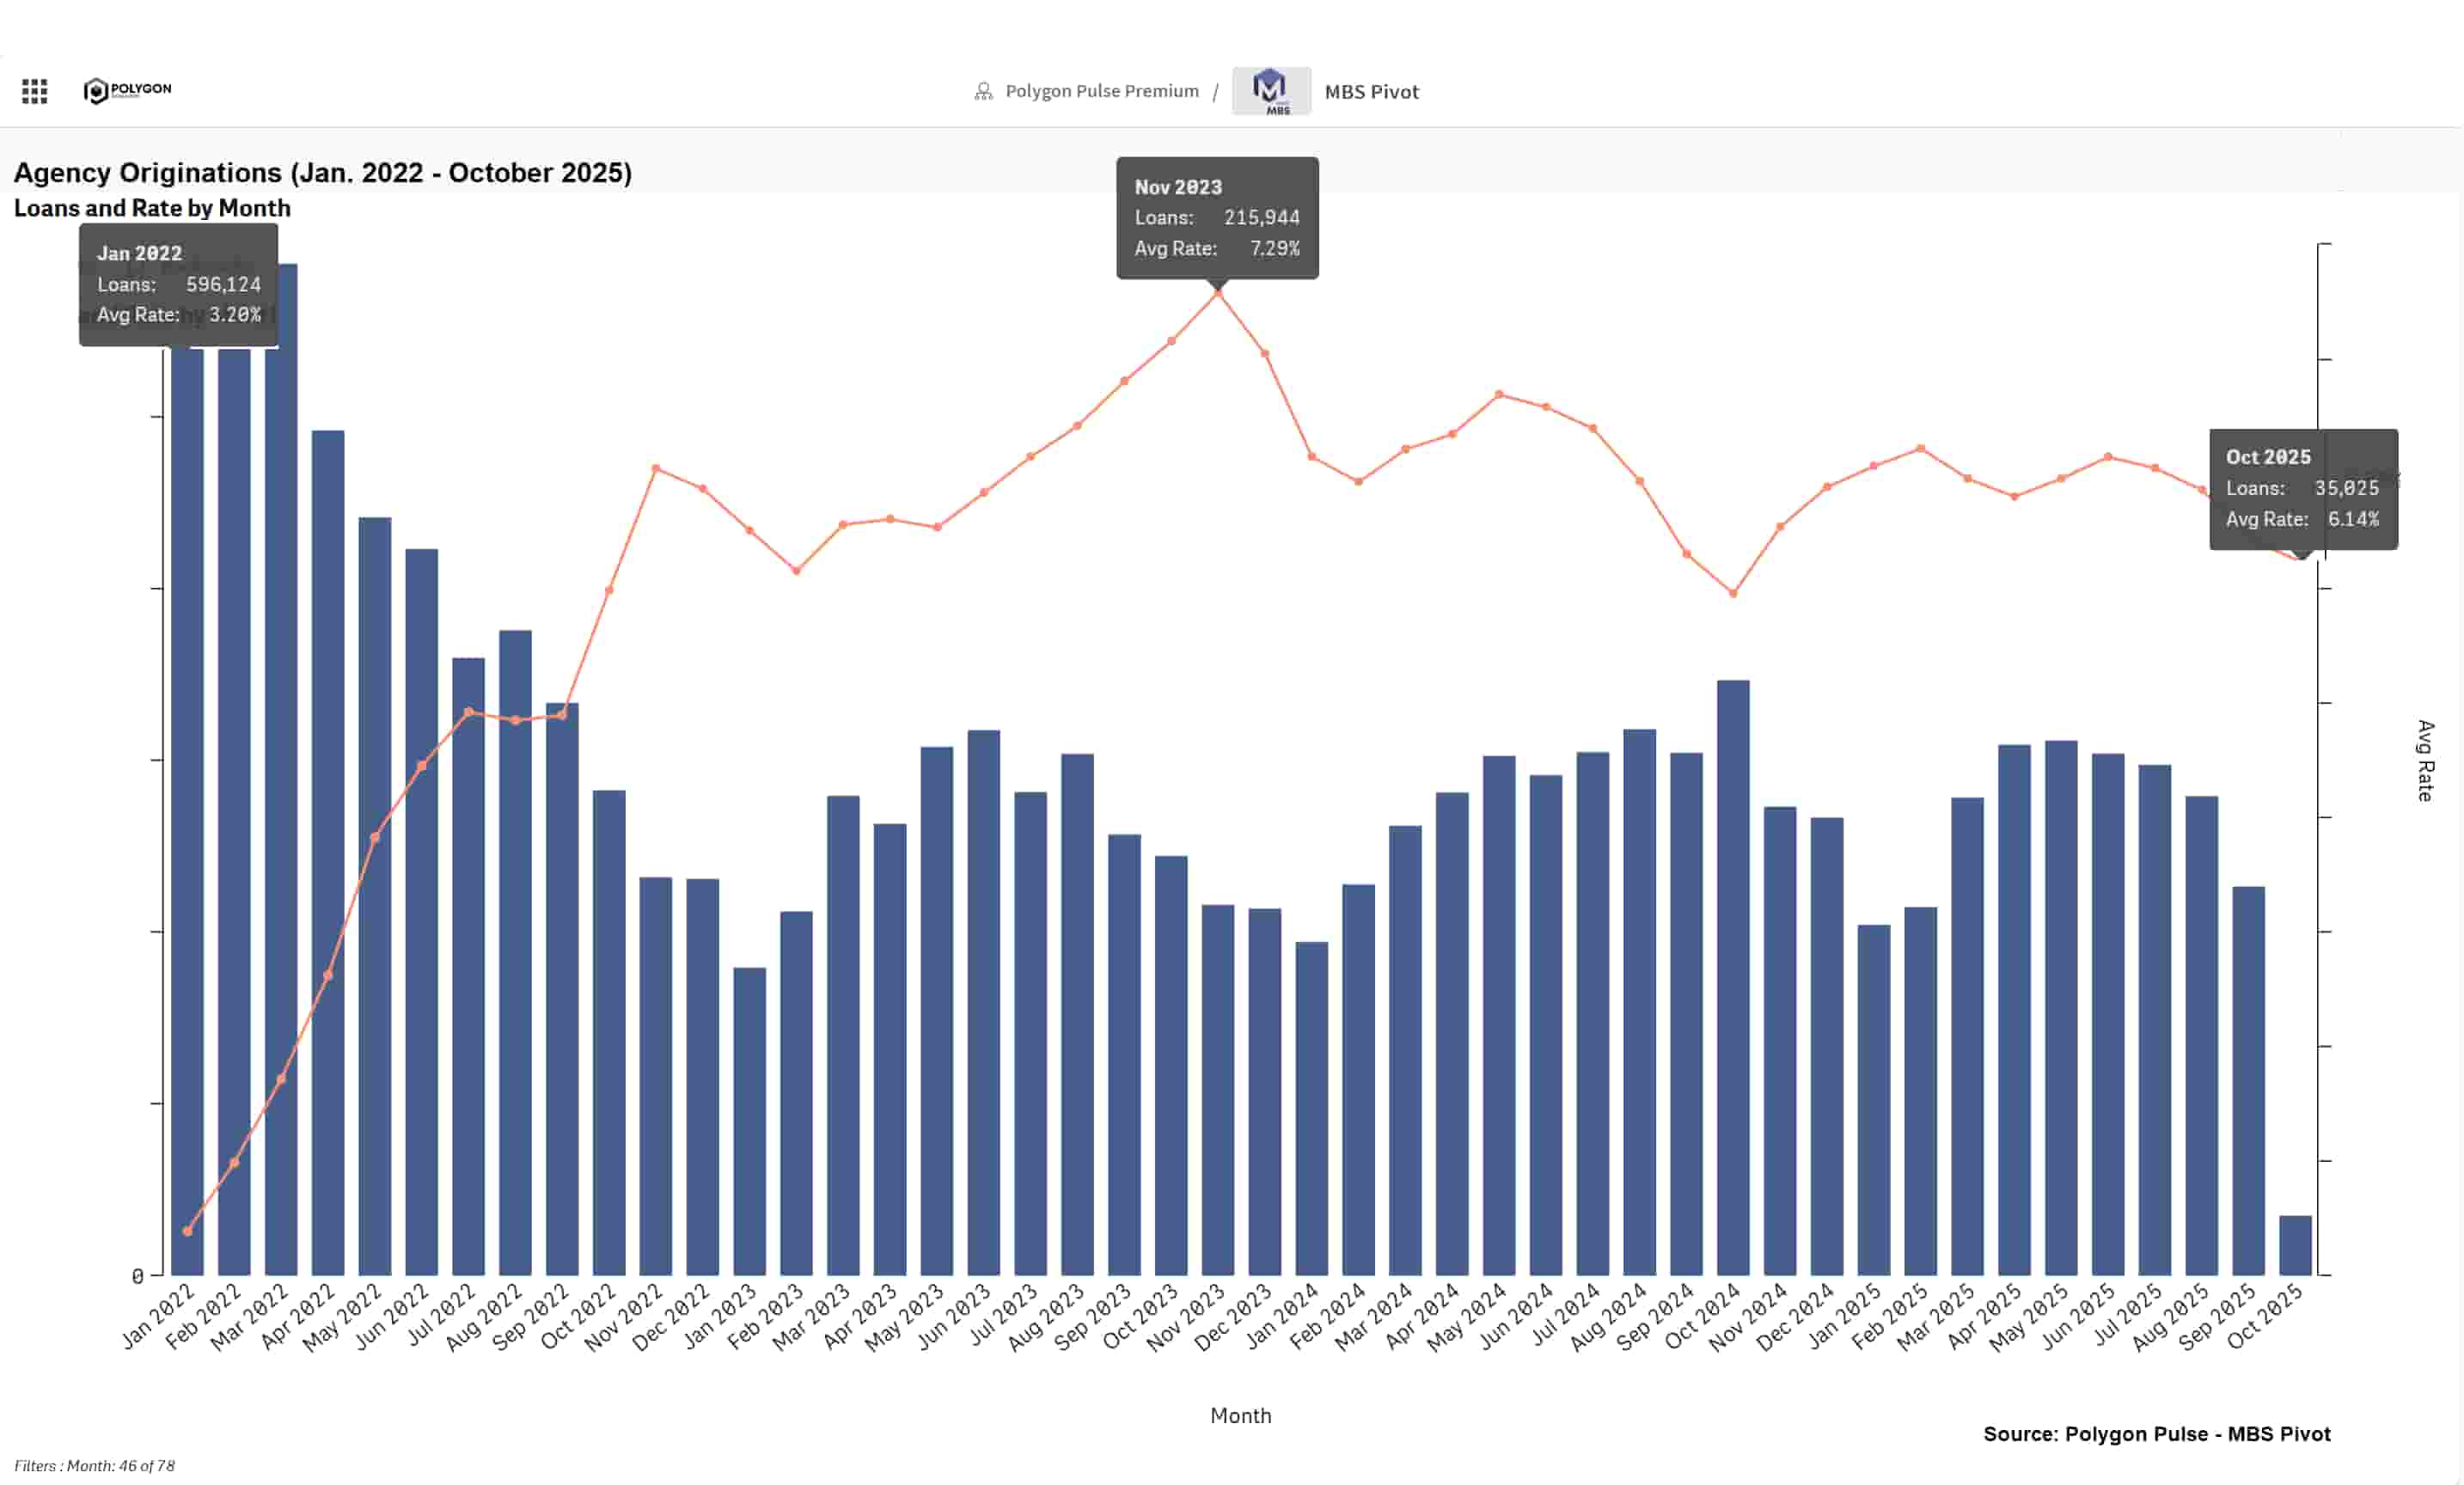
This chart illustrates the monthly movement of mortgage interest rates from early 2022 through late 2025 and the impact of originations volume (by count of loans) in the agency market.

While rates surged past 6% in late 2022 and exceeded 7% in 2023 and again in 2024, an important insight emerges: the overall volume of mortgage activity remained quite stable across 2023, 2024, and 2025.

This flat volume profile amid historically high and volatile rates suggests a shift in borrower composition, dominated by purchase activity rather than refinance, and a more insulated origination pipeline. For lenders, this means that even in high-rate environments, consistent volume could be maintained, but profitability levers shift to managing margins, loan quality, and secondary market execution.

From Analysis to Action

This analysis provides a clear blueprint for how to uncover meaningful market dynamics. Its true power is unleashed when you apply this same methodology to your own local markets. Because all real estate is local, this granular approach is essential for crafting precise strategies that effectively address the unique conditions of each community.

Ready to Continue? Get Your Exact Market Answers.

Go beyond generic insights. Polygon's interactive tools and limitless filtering empower you to tailor market data to your specific strategy.
Start your 7-day free trial.
Unlock My Custom Insights Now - Free Trial