Mortgage Rate Spread Matrix: GSE Loan Pricing by Credit Score & LTV
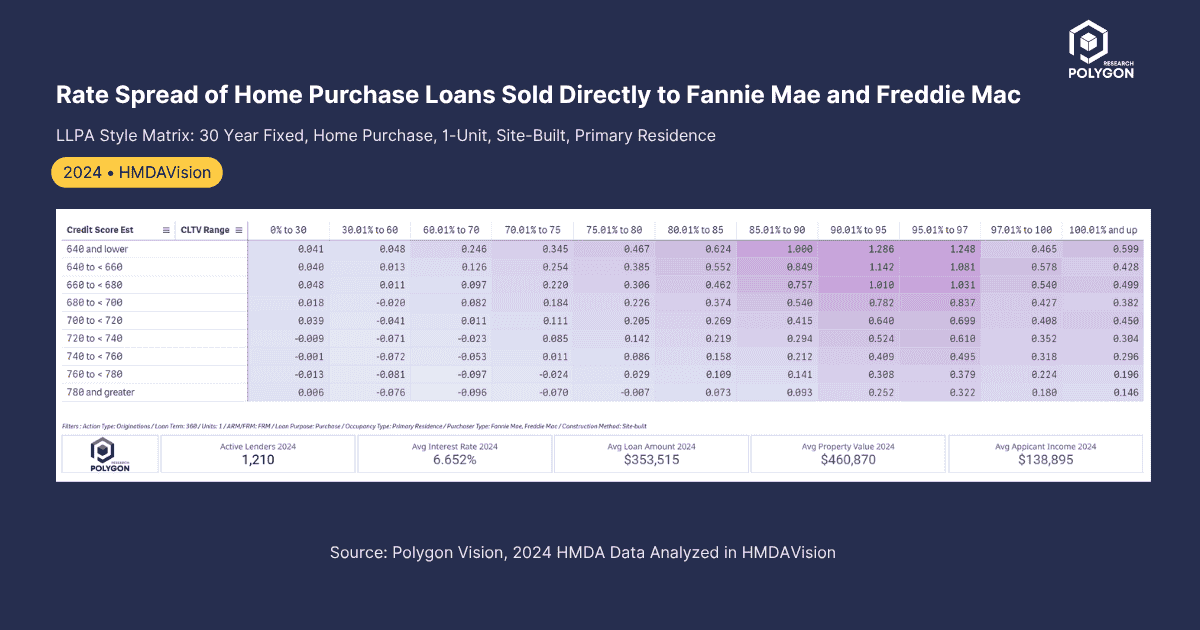
Polygon Research matrix shows rate spreads for 30-year fixed home purchase loans sold directly to Fannie Mae and Freddie Mac, organized by estimated credit scores (vertical) and Combined Loan-to-Value ratio (horizontal). We use modeled HMDA data to spotlight actual primary market pricing - employing reported rate spreads, CLTV, and our proprietary credit score estimation methodology.
It shows how lenders actually priced risk across different borrower profiles in the primary market in 2024.
Since GSE LLPAs flow through to borrower interest rates, this analysis bridges the gap between published fee matrices and real-world borrower pricing, providing transparency into how LLPA adjustments translate into actual rate spreads charged to consumers.
For this specific loan segment (30-year fixed, home purchase, 1-unit, site-built, primary residence), the average interest rate is 6.652% based on 1,210 active lenders. The matrix shows rate spreads varying from negative adjustments for prime borrowers to positive spreads for higher-risk profiles.
From Analysis to Action
Ready to Continue? Get Your Exact Market Answers.
Start your 7-day free trial.