Quantifying the VA IRRRL Market: High-Rate Loans from 2022-2024
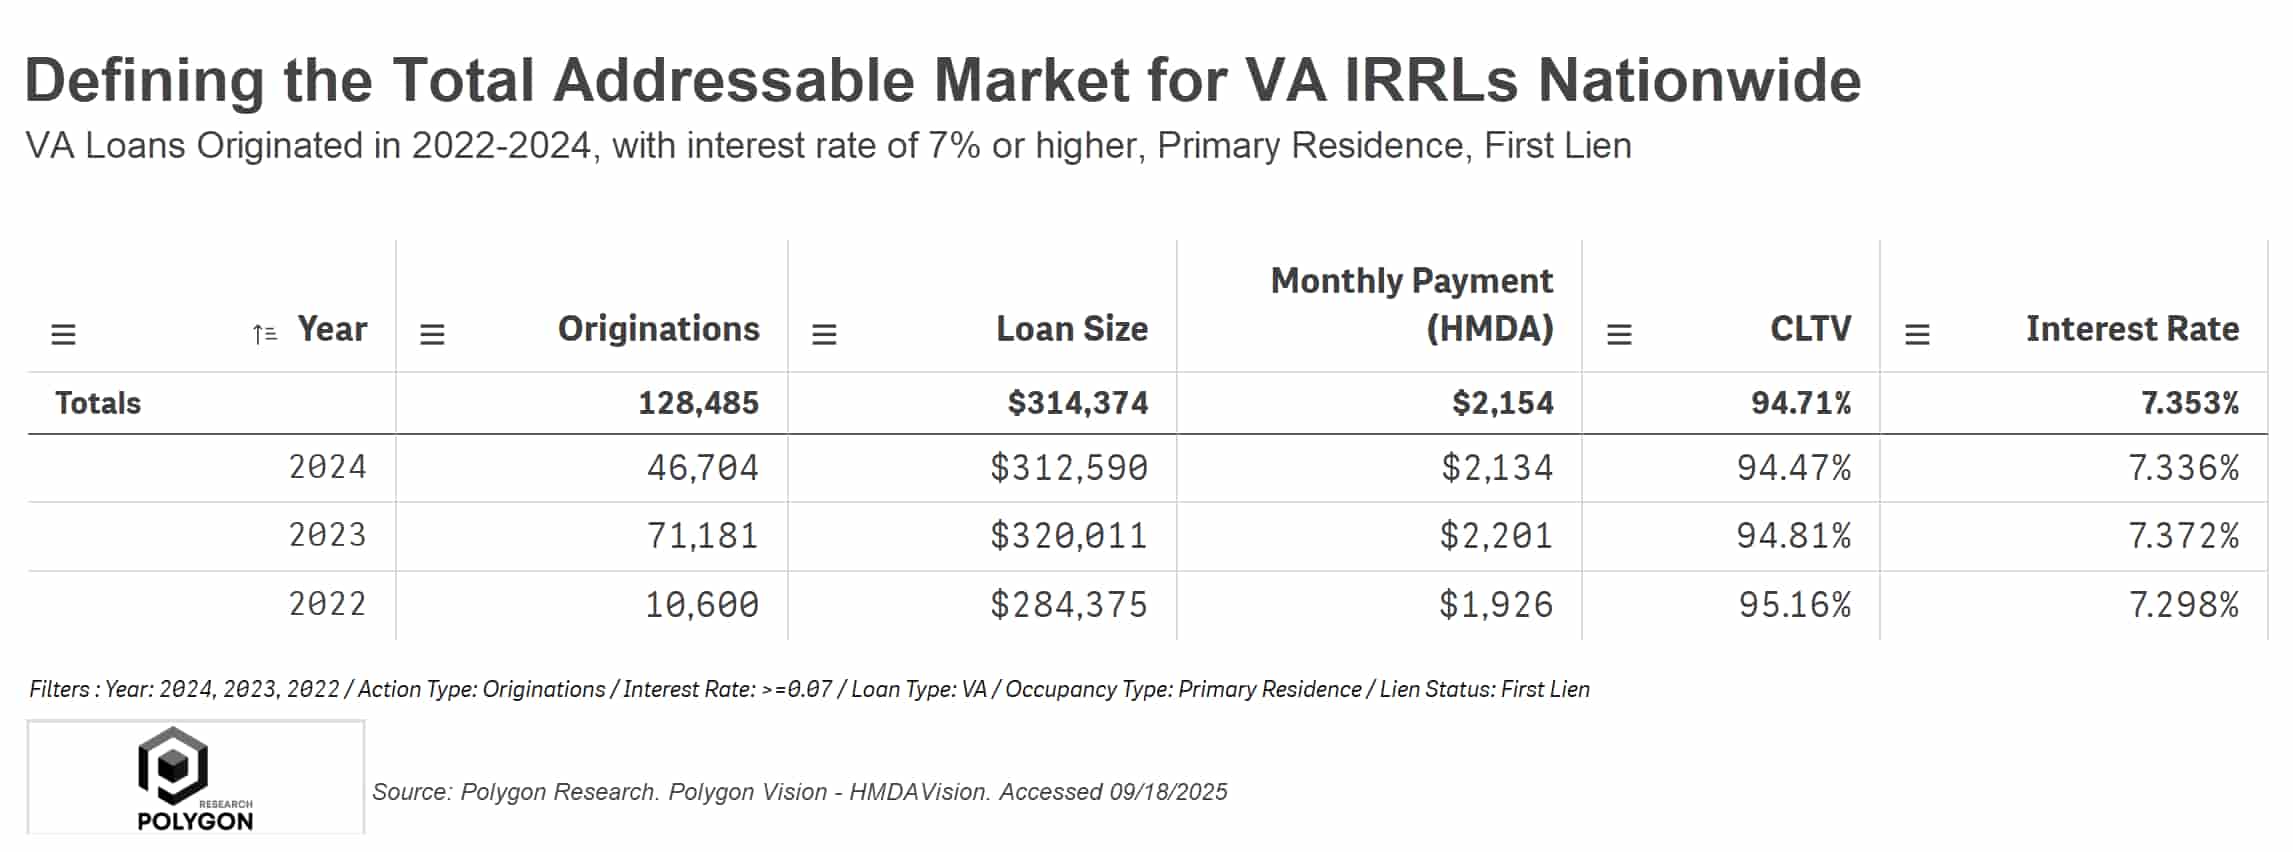
This table defines the Total Addressable Market (TAM) for VA Interest Rate Reduction Refinance Loans (IRRRLs) by isolating VA-guaranteed loans originated from 2022 to 2024 with interest rates of 7% or higher - nationwide, 128,485 loans or ~$40.4 billion in origination volume.
This framework shows lenders how to quantify the scale of the VA IRRL opportunity. Replicate this methodology within your specific market footprint - down to the state, county, zip code or even census tract level - to identify geographic concentrations of potential refinance segments.
Methodology: The TAM was calculated using HMDA data, filtering for VA, 1st lien, primary residence loans originated between 2022-2024 with interest rates of 7%+. This approach provides a high-level strategic estimate. HMDA data is a snapshot at origination and does not capture subsequent loan payoffs. It defines market size, not guaranteed eligible borrowers.
Despite these limitations, this is a powerful and practical tool for strategic planning. Its purpose is not to generate a list of individual leads, but to provide a reliable estimate of the market's scale and identify geographic "hot spots" of opportunity. This analysis enables lenders to transform a general goal into a data-driven strategy for efficient and targeted resource allocation.
From Analysis to Action
Ready to Continue? Get Your Exact Market Answers.
Start your 7-day free trial.