Refinance Costs Analysis: Comparing Borrower-Paid Fees by Lender Type

Loan Pricing
Chart Download and Page Share

Share or Download

Data Points

Lender Type  Loan Size  CLTV  Interest Rate  Total Loan Costs BPS  Monthly Payment (HMDA)    Totals  $315,000  69.40%  6.863%  158  $2,081    MBS of state member bank  $305,000  69.80%  6.99%  197  $1,989    Bank  $255,000  63.30%  6.875%  140  $1,697    Affiliate of a depository  $210,000  63.00%  6.875%  165  $1,353    Independent  $345,000  70.70%  6.75%  165  $2,266    Credit Union  $265,000  62.10%  6.75%  132  $1,711    MBS of bank holding company  $315,000  69.55%  6.688%  141  $2,045    Filters :  Year: 2024 / Action Type: Originations / Open-End LOC: Closed / Business or  Commercial Purpose: Not for Business Purpose / Loan Term: 360 / Interest  Rate: 9280 of 16711 / ARM/FRM: FRM / Loan Purpose: Refi / Occupancy Type:  Primary Residence / Lien Status: First Lien / Purchaser Type: Fannie Mae,  Freddie Mac / Construction Method: Site-built

Date Published:
September 25, 2025
Date Updated:
September 25, 2025
Chart type:
Table
Suggested Citation:
Polygon Research, "Median Borrower-Paid Total Loan Costs for Rate/Term Refinancing By Lender Type (in bps)," Polygon Vision – HMDAVision, accessed September 2025. Filters: 2024; Closed-end; Refinance (rate/term); Primary Residence; First Lien; Sold directly to Fannie Mae, Freddie Mac; Site-Built; Interest Rate >= 0.065.
Key Insight and Commentary

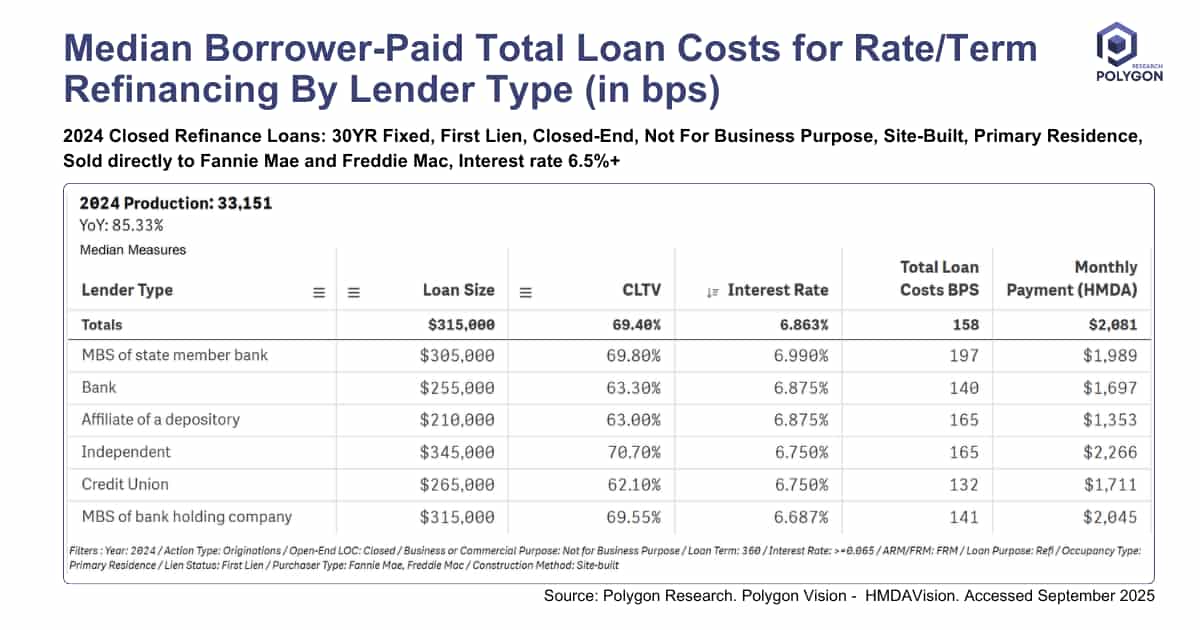
Clear lines emerged in the 2024 rate/term refi market for prime, GSE-eligible loans. Credit unions are the undisputed price leaders, charging a median of only 132 bps by serving a low-risk segment: borrowers with the most home equity (median CLTV of 62.10%).

IMBs are playing a different game, tackling larger loans ($345,000) for borrowers with less equity (CLTV of 70.70%), which is reflected in their higher costs (165 bps). Banks and depository affiliates land in the middle. While this national snapshot is a critical benchmark, the real competition is always local. HMDAVision users can instantly filter this analysis to their specific county or MSA to see exactly where they stand against their true competitors.

Credit Unions' low-cost leadership creates a retention paradox. Prime, high-equity members are the most attractive targets for competitors. The strategic imperative is to build loyalty beyond price - e.g. proactively offer HELOCs to deepen the member relationship before they are lured away.

Promptly diagnose your strategy. Are your higher fees intentional (a reflection of your risk appetite for higher-LTV) or a result of operational friction? Use these benchmarks to sharpen your efficiency or to double-down on a value proposition (e.g., speed, specialized products) that justifies your premium in your specific markets.

From Analysis to Action

This analysis provides a clear blueprint for how to uncover meaningful market dynamics. Its true power is unleashed when you apply this same methodology to your own local markets. Because all real estate is local, this granular approach is essential for crafting precise strategies that effectively address the unique conditions of each community.

Ready to Continue? Get Your Exact Market Answers.

Go beyond generic insights. Polygon's interactive tools and limitless filtering empower you to tailor market data to your specific strategy.
Start your 7-day free trial.
Unlock My Custom Insights Now - Free Trial