Refinance Rates July 2025 vs July 2024 by Loan Type
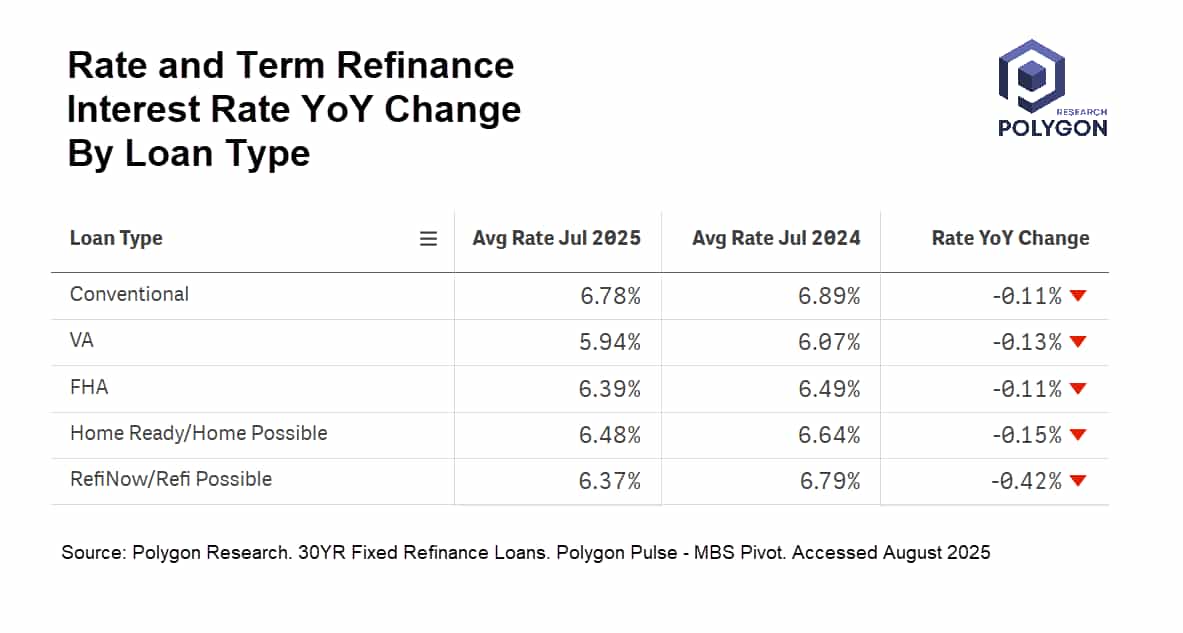
This chart presents a year-over-year comparison of average interest rates for 30-year fixed rate and term refinance loans, segmented by loan type, for July 2025 versus July 2024.
The data reveals a universal, albeit modest, decline in rates across all categories. Conventional and FHA loans saw the smallest decrease at -11 basis points (bps), while VA and Home Ready/Home Possible loans experienced slightly larger drops of -13 bps and -15 bps, respectively.
The most compelling observation is the substantial -42 bps decline for RefiNow and Refi Possible loans. These GSE programs are specifically designed to expand refinancing access for lower-income borrowers. This outsized rate improvement suggests increased liquidity or heightened competitive pricing within this specific market segment.
For decision-makers, this data highlights a clear strategic opportunity. Lenders can leverage this trend by intensifying marketing for affordable refinance programs to capture market share and improve portfolio retention among this demographic. It also signals to capital markets teams that MBS pools backed by these loans may experience different prepayment behavior, warranting a closer look at pricing and hedging strategies.
From Analysis to Action
Ready to Continue? Get Your Exact Market Answers.
Start your 7-day free trial.