Top 10 HUD Section 184 Lenders for Home Purchase Loans: 2025 YTD

Government Loans
Table showing the top 10 Lenders to Native Americans by Home Purchase Loan Count. Two additional columns show the loan amount and interest rate. From Polygon Pulse - MBS Pivot.
Chart Download and Page Share

Share or Download

Data Points
Seller/Issuer Name YTD 2025 Avg Loan Amount Avg Rate CLICK N' CLOSE INC 372 $325,328 6.39% NEWREZ LLC 94 $268,489 6.26% GUILD MORTGAGE COMPANY LLC 87 $278,023 6.39% FIRST UNITED BANK AND TRUST 80 $268,050 6.26% BOKF NA 65 $266,969 6.36% THE MONEY SOURCE INC 42 $258,595 6.50% GATEWAY MORTGAGE A DIVISION OF GATEWAY FIRST BANK 40 $263,000 6.59% PLAZA HOME MORTGAGE INC 39 $270,513 6.30% ARVEST BANK 34 $252,647 6.24% GLOBAL FEDERAL CREDIT UNION 33 $362,424 6.25%
Date Published:
December 4, 2025
Date Updated:
December 4, 2025
Chart type:
Tabe
Suggested Citation:
Polygon Research. "Top 10 HUD Section 184 Lenders for Home Purchase Loans – 2025 YTD." Polygon Vision – MBS Pivot. Accessed December 2025. Filters: Loan Type = HUD Section 184; Loan Purpose = Purchase; Geography = United States; Date = YTD 2025.
Key Insight and Commentary

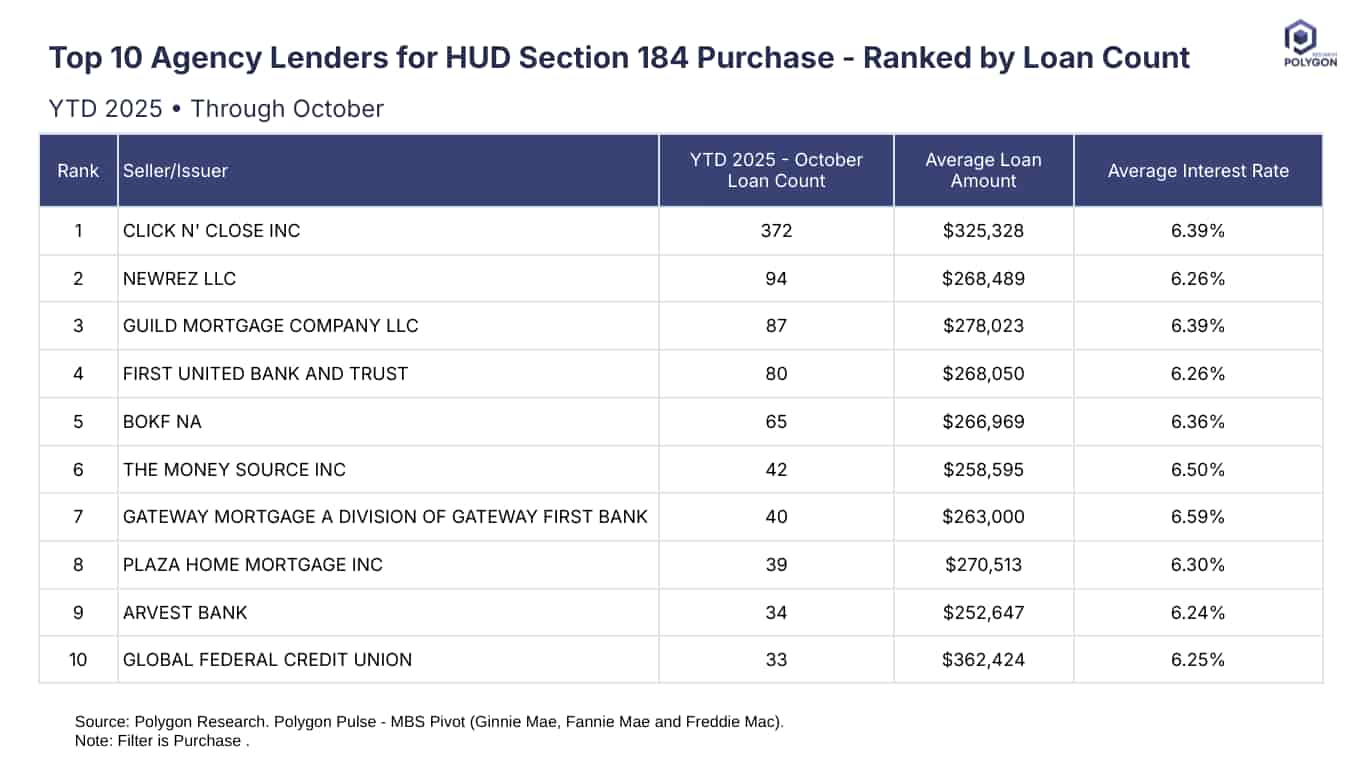
This chart ranks the top 10 lenders by volume of HUD Section 184 home purchase loans for 2025 year-to-date, based on data from Polygon Research’s MBS Pivot tool. The Section 184 program serves Native American borrowers, and the lender distribution reveals a highly concentrated market. The top lender shows a notably higher count of purchase loans than others, followed by a steep drop-off among ranks 4 through 10. This pattern suggests that a few institutions have either specialized operational capabilities or stronger relationships within tribal and Native communities, enabling them to scale their outreach and loan fulfillment.

For stakeholders, this ranking serves multiple purposes. Competitors can benchmark their performance and identify partnership opportunities. Policymakers and housing advocates can also assess whether access to HUD 184 financing is broad-based or narrowly distributed. Furthermore, potential entrants might study the operating models of top lenders to reduce barriers in reaching underserved borrowers in tribal jurisdictions.

This data can inform lender expansion strategies, government efforts to diversify participation, and housing counseling programs aiming to connect borrowers to more options.

From Analysis to Action

This analysis provides a clear blueprint for how to uncover meaningful market dynamics. Its true power is unleashed when you apply this same methodology to your own local markets. Because all real estate is local, this granular approach is essential for crafting precise strategies that effectively address the unique conditions of each community.

Ready to Continue? Get Your Exact Market Answers.

Go beyond generic insights. Polygon's interactive tools and limitless filtering empower you to tailor market data to your specific strategy.
Start your 7-day free trial.
Unlock My Custom Insights Now - Free Trial