Understanding First-Time Homebuyer Data Discrepancies: A Source Comparison
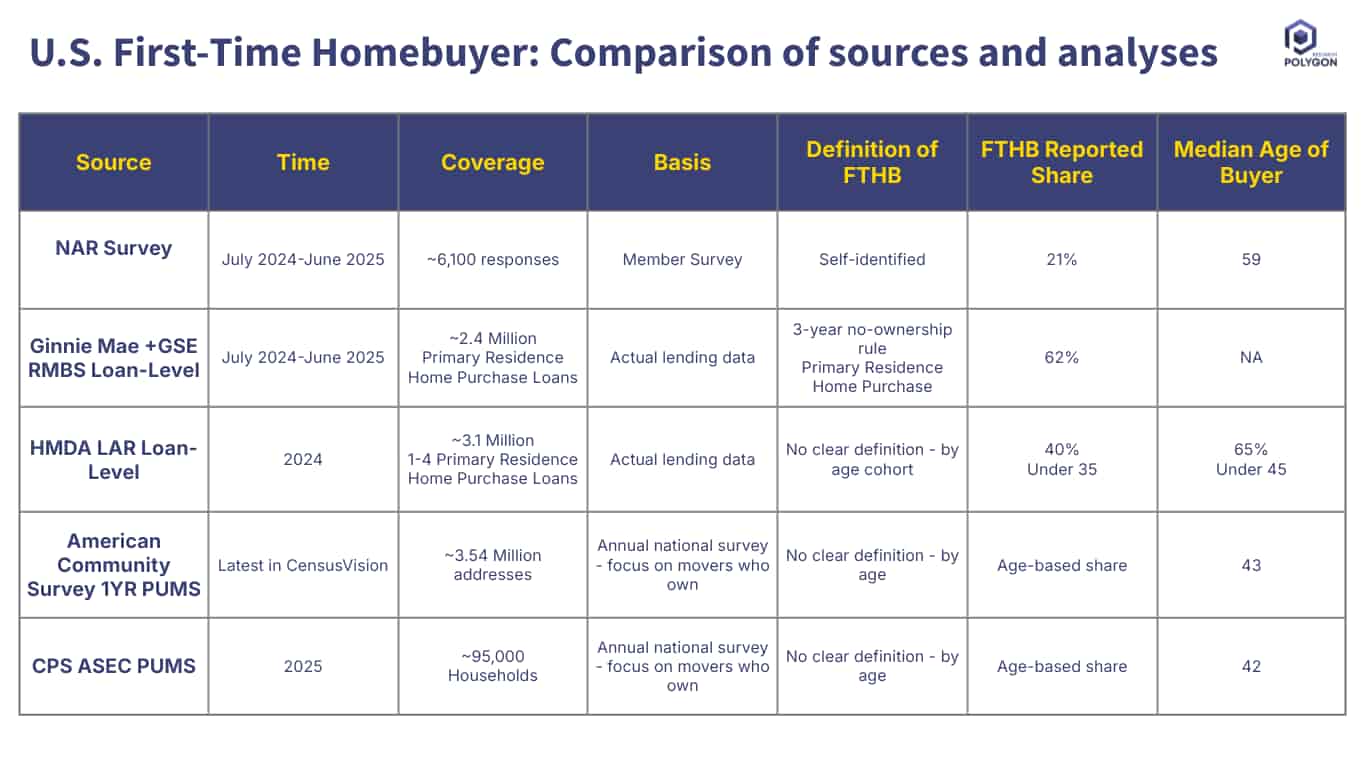
Industry leaders are often faced with conflicting headlines about the strength of the first-time homebuyer (FTHB) market. This table reconciles these competing realities by comparing the five most common FTHB data sources.
NAR Survey (21% Share): This figure is based on a member survey (a sample of ~6,100 responses) and uses a "self-identified" definition.
Ginnie Mae + GSE Data (62% Share): This figure is based on actual lending data (a census of ~2.4 million agency loans) and uses the industry-standard, technical definition: a "3-year no-ownership rule." This is the objective measure to define the FTHB market for program and underwriting purposes.
The other data sets (HMDA, ACS, CPS) do not have a true FTHB flag and must use age as a proxy (e.g., buyers under 35 or 45).
How to Use This Data:
For Lenders: Do not be alarmed by the low 21% NAR figure. The technical FTHB market, as defined by your agency partners, remains exceptionally strong at 62% of all primary residence purchases.
For Analysts: Precision is paramount. When citing FTHB data, you must specify the source and definition. Are you discussing the subjective, re-entry buyer (NAR) or the objective, technically-defined buyer (GSE)? Both are valid, but they are not the same market.
From Analysis to Action
Ready to Continue? Get Your Exact Market Answers.
Start your 7-day free trial.