Which US Cities Have the Most Competitive Refinance Markets?
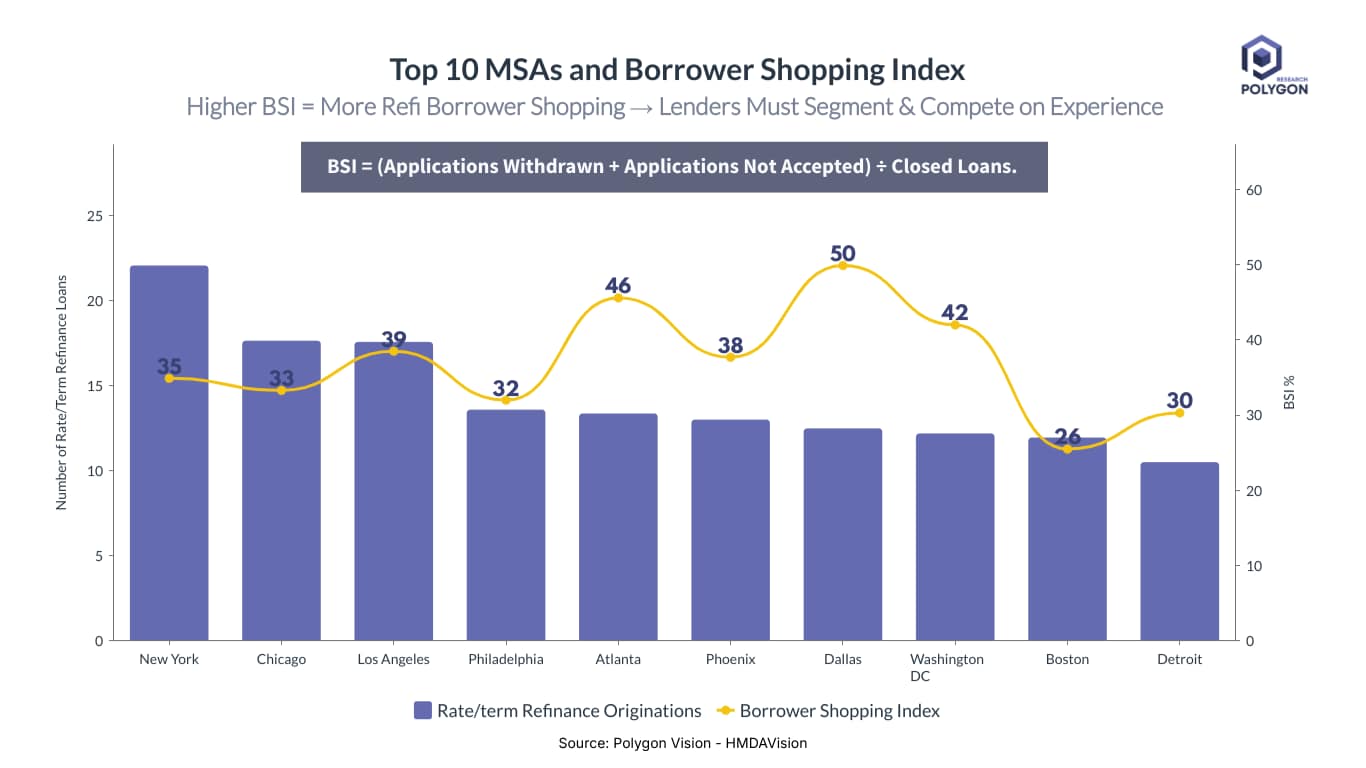
To measure mortgage refinance competitiveness, we use the Borrower Shopping Index (BSI). This metric quantifies how actively borrowers are comparing offers in a specific market. It is calculated by dividing the number of non-converted applications (those withdrawn by the borrower or not accepted by the lender) by the number of closed loans. A higher BSI indicates a more competitive environment with greater "fallout."
This chart reveals that the highest-volume markets are not always the most competitive. While New York and Los Angeles lead in rate/term refinance originations, Dallas has the highest BSI at 50%. For every two loans a lender closes in Dallas, one application fails to convert. Atlanta (46%) and Washington D.C. (42%) are also hyper-competitive, signaling that borrowers are actively comparing multiple offers.
For lenders, this insight is critical for tailoring regional strategies. In high-BSI markets, a competitive rate is merely the price of entry. To win the deal, lenders must deliver a superior customer experience characterized by speed, proactive communication, and a seamless digital process. This data helps leadership decide where to invest in technology and training to reduce fallout and improve conversion rates.
From Analysis to Action
Ready to Continue? Get Your Exact Market Answers.
Start your 7-day free trial.