The market is on the verge of a significant shift. Refinance activity is a leading indicator of borrower behavior and lender opportunity. In 2024, rate-and-term refinance originations surged 60% year-over-year to nearly 700,000 loans, signaling renewed borrower interest despite elevated rates. Fannie Mae forecasts that the refinance share of mortgage originations will rise from 26% in 2025 to 35% in 2026. This translates to approximately 1.8 million refinance loans, more than double the levels of rate term refinances seen in 2024.
But volume isn’t the only story. The Borrower Shopping Index (BSI) measures how often borrowers apply with multiple lenders, calculated as applications withdrawn or not accepted divided by closed loans.
We calculate BSI using HMDA data as:
BSI = (Applications Withdrawn + Applications Not Accepted) ÷ Closed Loans.
A higher BSI indicates that borrowers are more aggressively shopping for rates and terms, forcing lenders to compete on more than just price.
A rising BSI signals heightened competition and price sensitivity. In 2024, BSI climbed to 34.2% nationally, up from 30.6% in 2023 and 31.1% in 2019. By 2026, we expect this index to exceed 40%, making borrower segmentation and competitive positioning critical, a key metric that serves as a proxy for how often borrowers apply with multiple lenders, is already high in many major markets. This signals that the upcoming refinance boom will be fiercely competitive.
A look at the 2024 data shows that this shopping intensity varies widely across major metropolitan statistical areas (MSAs).
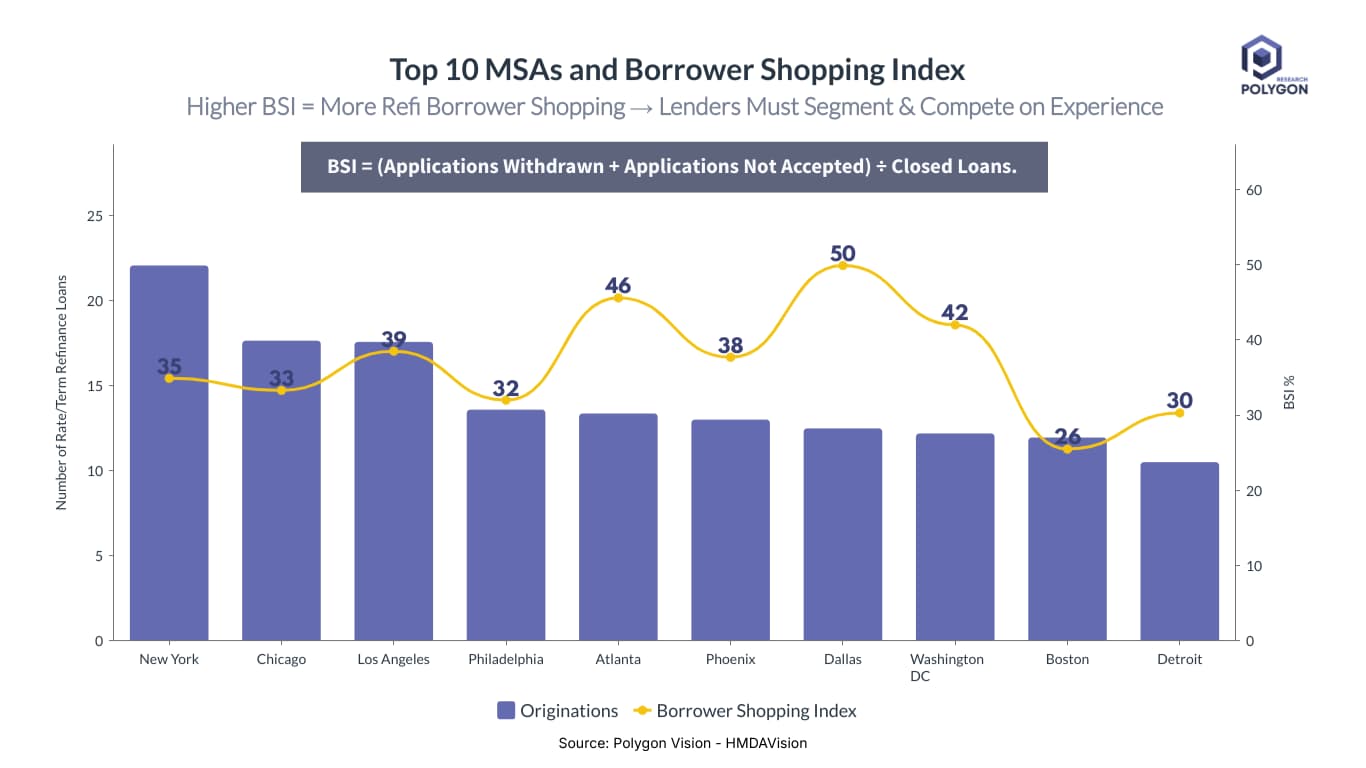
BSI changes are not uniform as some MSAs saw increases, others declines, as we see in the table below.
Not all markets behave the same. While borrower shopping intensity surged in Boston (+4.3%) and Philadelphia (+3.8%), it dropped sharply in Phoenix (-8.2%) and Dallas (-4.8%). These shifts matter. Lenders should prioritize markets where competition is heating up and adjust strategies where pressure is easing.
The BSI is a signal for lenders about consumer choice and behavior. When borrowers shop more aggressively, competing on price alone isn’t enough. Winning in 2026 requires a focused strategy.
Use HMDA and Census data to identify refinance-ready borrower segments and high-BSI MSAs.
Blanket marketing is inefficient. Create targeted campaigns by segmenting potential borrowers by age, income, geography, and existing product mix. A prime target group, for example, will be the cohort of borrowers who originated loans in 2022–2023 and currently have interest rates above 6.5%.
Use your internal data, vendor data, and MBS data to benchmark pricing monthly. You can use your own data to construct real-time BSI, benchmark it, and use it as a guide for your product marketing strategies.
Look for efficiencies and to improve borrower experience. When rates are comparable, a seamless, fast, and transparent application process becomes the key differentiator. But beware - not all has to be heavy technology and software - sometimes it's just old fashioned process and employee training.
Deploy proactive outreach in battleground markets. Don't wait for applications to come to you. Launch targeted outreach campaigns in the battleground markets you've identified to engage potential borrowers before they even start shopping.
The 2026 refinance market will be a period of immense opportunity defined by both high volume and high competition. Lenders who invest in data-driven segmentation, local market intelligence, and strategic positioning now will be the ones who successfully capture the surge.
Explore Polygon Research's HMDAVision and CensusVision tools to
👉 Start your free trial today and turn market data into a competitive advantage.
Refinance volumes are projected to double by 2026, and borrower shopping behavior is intensifying. Here’s how you can prepare your lending strategy now to capture the coming wave.
The market is on the verge of a significant shift. Refinance activity is a leading indicator of borrower behavior and lender opportunity. In 2024, rate-and-term refinance originations surged 60% year-over-year to nearly 700,000 loans, signaling renewed borrower interest despite elevated rates. Fannie Mae forecasts that the refinance share of mortgage originations will rise from 26% in 2025 to 35% in 2026. This translates to approximately 1.8 million refinance loans, more than double the levels of rate term refinances seen in 2024.
But volume isn’t the only story. The Borrower Shopping Index (BSI) measures how often borrowers apply with multiple lenders, calculated as applications withdrawn or not accepted divided by closed loans.
We calculate BSI using HMDA data as:
BSI = (Applications Withdrawn + Applications Not Accepted) ÷ Closed Loans.
A higher BSI indicates that borrowers are more aggressively shopping for rates and terms, forcing lenders to compete on more than just price.
A rising BSI signals heightened competition and price sensitivity. In 2024, BSI climbed to 34.2% nationally, up from 30.6% in 2023 and 31.1% in 2019. By 2026, we expect this index to exceed 40%, making borrower segmentation and competitive positioning critical, a key metric that serves as a proxy for how often borrowers apply with multiple lenders, is already high in many major markets. This signals that the upcoming refinance boom will be fiercely competitive.
A look at the 2024 data shows that this shopping intensity varies widely across major metropolitan statistical areas (MSAs).
BSI changes are not uniform as some MSAs saw increases, others declines, as we see in the table below.
Not all markets behave the same. While borrower shopping intensity surged in Boston (+4.3%) and Philadelphia (+3.8%), it dropped sharply in Phoenix (-8.2%) and Dallas (-4.8%). These shifts matter. Lenders should prioritize markets where competition is heating up and adjust strategies where pressure is easing.
The BSI is a signal for lenders about consumer choice and behavior. When borrowers shop more aggressively, competing on price alone isn’t enough. Winning in 2026 requires a focused strategy.
Use HMDA and Census data to identify refinance-ready borrower segments and high-BSI MSAs.
Blanket marketing is inefficient. Create targeted campaigns by segmenting potential borrowers by age, income, geography, and existing product mix. A prime target group, for example, will be the cohort of borrowers who originated loans in 2022–2023 and currently have interest rates above 6.5%.
Use your internal data, vendor data, and MBS data to benchmark pricing monthly. You can use your own data to construct real-time BSI, benchmark it, and use it as a guide for your product marketing strategies.
Look for efficiencies and to improve borrower experience. When rates are comparable, a seamless, fast, and transparent application process becomes the key differentiator. But beware - not all has to be heavy technology and software - sometimes it's just old fashioned process and employee training.
Deploy proactive outreach in battleground markets. Don't wait for applications to come to you. Launch targeted outreach campaigns in the battleground markets you've identified to engage potential borrowers before they even start shopping.
The 2026 refinance market will be a period of immense opportunity defined by both high volume and high competition. Lenders who invest in data-driven segmentation, local market intelligence, and strategic positioning now will be the ones who successfully capture the surge.
Explore Polygon Research's HMDAVision and CensusVision tools to
👉 Start your free trial today and turn market data into a competitive advantage.