
Talk to almost any mortgage lender and the themes sound familiar.
“We’re always hiring.”
“We can’t keep top producers.”
“Our branches feel like revolving doors.”
Most of the industry advice lenders hear from vendors and consultants reinforces the same story. If you just recruit more top producers and find better ways to retain them, production will take care of itself. Recruit and retain.
The trouble is that many lenders follow this advice, invest heavily in recruiting and retention, and still feel like they are running in place. The sales force never quite feels stable. Branches go through repeated rebuilds. Leadership spends more time talking about headcount than about the borrower experience or long-term strategy.
At Polygon Research, when we look at the NMLS mortgage loan originator (MLO) licensing data we model in HMDAVision, we see the other side of this story. Underneath the production numbers, there is a lot of quiet churn. Teams that appear fully staffed on paper are constantly being reconstructed in the background. Recruitment is happening, but retention is not keeping pace.
That is what the recruitment and retention treadmill looks like from a data perspective.
Recruitment and retention alone cannot solve a problem that has never been clearly measured.
If your only view of the LO workforce is a headcount report and a production ranking, you never see the actual dynamics underneath. You know how many LOs you have today and who closed the most loans last quarter. You do not know how many people you had to hire to get there, how many left, or how long your loan officers typically stay before moving on.
In that environment, every new initiative is judged by feel. A new recruiter seems busy. A new compensation plan seems attractive. A new culture program seems well received. Yet the underlying pattern of exits and tenure may be unchanged. You may be pouring more and more effort into refilling the same seats.
This is why recruitment and retention can feel like a treadmill. Without metrics that describe turnover and tenure, it is almost impossible to tell whether you are building a more stable platform or simply moving faster to stay in the same place.
The missing lens is not another tactic. It is a clear, quantitative view of how often loan officers leave and how long they actually stay.
Loan officer turnover is a simple idea with powerful implications. It answers a straightforward question: what share of your LO workforce leaves in a typical year?
In HMDAVision, using NMLS MLO licensing data per lender, we first calculate the number of MLOs - an annualized average of the daily count of active MLOs by lender.
Note: Some individuals included in the MLO statistics may hold NMLS licenses through their employer for compliance or internal policy reasons, even if they do not actively originate loans.
We also calculate an annualized average of the daily tally of days employed per MLO per lender. This is the average MLO tenure. The sum of all terminations throughout the year divided by the average annual tenure, by lender, gives us this MLO Turnover rate per lender. Turnover rates over 100% are possible and could indicate a uni-directional downward employment change or a more choppy hiring/termination environment.
When we apply these measurements across retail independent mortgage bankers in HMDAVision, patterns emerge that rarely show up in standard production reports.
Filtering for the top 25 retail independent lenders, we often see average MLO tenure in the range of 2 to 6 years, combined with annual turnover rates between 3% and 58%. Many of these lenders have LO workforces where the typical LO stays only a few years and a significant share of the roster turns over every year.
Lenders with high MLO turnover rates effectively rebuild their sales forces at a rapid pace. Others show notably lower turnover and longer tenure, suggesting more stable teams even in volatile markets.
Here is a snapshot of a trend for the retail IMB segment's MLO Tenure and Turnover from 2020 through 2024.
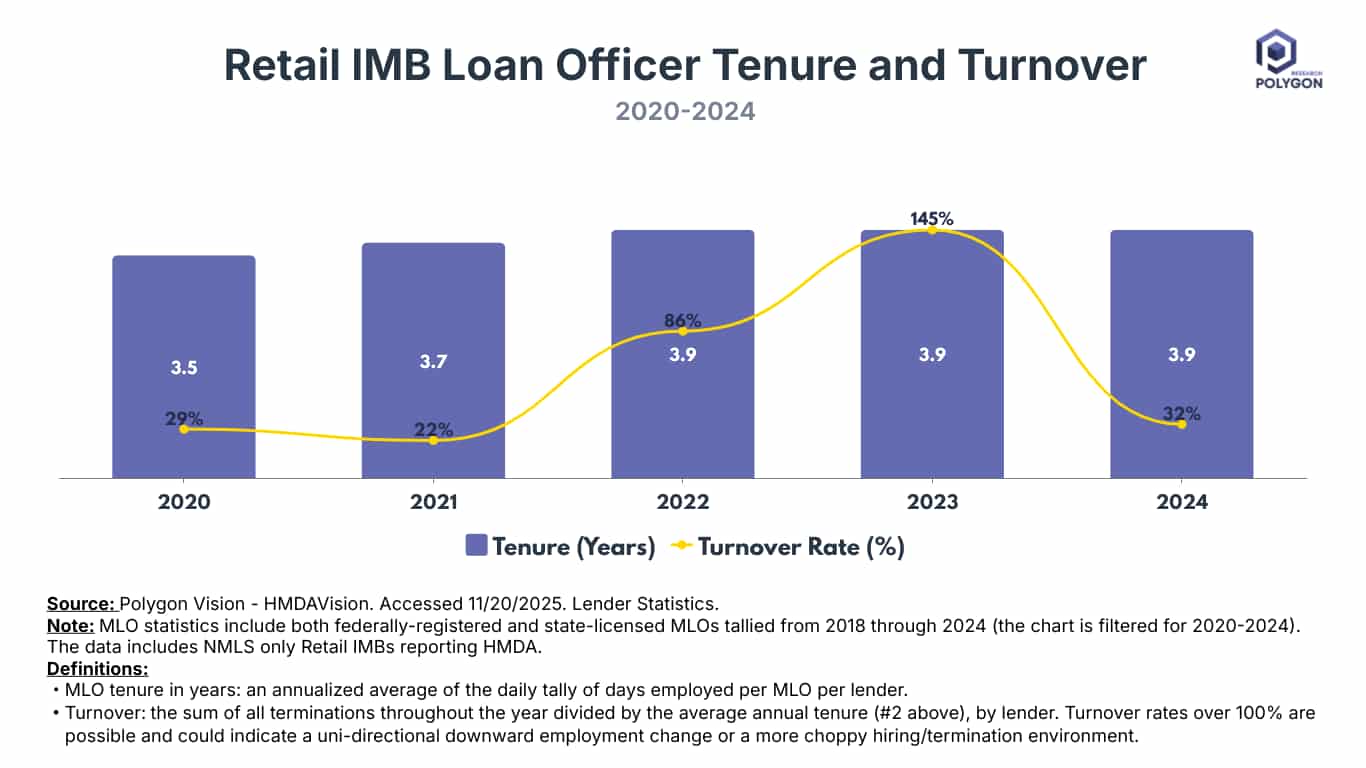
We see that the tenure has increased slightly - from 3.5 years to 3.9 years, but the MLO turnover varied widely.
Turnover is paired with tenure. MLO tenure measures how long, in years, the average loan officer stays with a specific lender. A tenure of 3.9 years means the typical LO is with that institution for just under four years before terminating employment there.
Taken together, turnover and tenure give you a much more realistic picture than a static headcount. They show not just how many loan officers you have on a given date, but how stable or unstable that workforce is over time.
Retail Independent Lenders had an average 32% MLO turnover rate and a 3.9-year MLO average tenure in 2024. This means that in a typical year, about one in three MLOs left their positions, while the average MLO stayed with the company for just under four years before moving on.
Turnover is a metric rarely used in competitive analyses and mortgage strategic plans, but it shapes both production and the borrower experience.
A lender with moderate turnover and longer tenure tends to accumulate institutional knowledge. Loan officers understand the lender’s products, pricing posture, overlays, and risk appetite. They know the local markets, referral partners, and internal processes. When a borrower returns to refinance or buy a new home, there is a reasonable chance of working with the same LO or at least someone deeply familiar with the company’s way of doing business.
A lender with high turnover lives in a different reality. New LOs are continually onboarding and learning systems and policies in real time. Others are leaving, sometimes taking relationships with them. Branches go through repeated resets. Borrowers are more likely to encounter an LO who is still learning the lender’s pricing and credit culture, and who may not be there for the borrower’s next transaction.
At the same time, borrowers themselves are increasingly becoming less dependent on any single loan officer for information. Before they ever speak to an LO, many borrowers have already compared offers online, read articles and posts about fees, discount points, and lender credits, and in some cases asked AI tools whether a specific quote makes sense for their credit profile and down payment.
In this environment, high turnover and short tenure can introduce more variability in how products and costs are explained and how options are framed. Two borrowers with similar profiles may hear different stories depending on whether they happen to reach a seasoned LO or someone new to the organization. From a fair lending and consumer-protection standpoint, that inconsistency matters.
Turnover, in other words, has a direct line to the quality and consistency of the borrower experience, even if the topline production numbers look fine.
In our HMDAVision tool, we filtered the top 25 lenders in 2024 to compare their MLO Turnover rate with their Borrower Shopping Index (BSI). The institutions with the very highest MLO turnover also show some of the highest borrower shopping indices. For example, Newrez’s turnover is roughly 58%, and its borrowers withdraw or decline offers at a rate above 100% of closed loans.
At the same time, we see lenders with high shopping but low turnover, and vice versa, which tells us turnover is one part of the story, not the whole story. Product focus, pricing posture, and lead funnels all matter too.
All of this does not mean recruitment and retention are unimportant. They remain essential parts of running a mortgage business. But it does mean that a “recruit and retain” playbook is not enough on its own.
Once you see your true turnover and tenure profile, the conversation changes. Recruitment is no longer just “hire more top producers”; it becomes “hire in a way that makes sense given how quickly people move in and out of our organization.” Retention is no longer “do something to keep everyone”; it becomes “identify where longer tenure is most critical for the borrower experience and for risk, and focus our efforts there.”
A lender with high turnover in certain segments or geographies may decide that the real priority is stabilizing those teams, not just adding more people into the funnel. A lender with unusually strong tenure in specific markets may want to understand what is working there and replicate those conditions elsewhere.
With turnover and tenure in view, “recruit and retain” stops being a one-sided slogan and becomes part of a broader, more realistic strategy. Instead of trying to outrun churn, leadership can design a model that anticipates movement in the LO workforce and builds a borrower experience resilient enough to withstand it.
At that point, the key question is no longer whether turnover matters, but where your own organization actually stands.
This is exactly why we brought NMLS data and modeled these metrics for MLO turnover and tenure into HMDAVision alongside HMDA loan-level data.
HMDAVision allows you to see, for each lender:
These MLO statistics live next to detailed information about loan volumes, pricing, borrower characteristics, product mix, and borrower shopping behavior. That combination gives you a more complete view of how human capital and borrower outcomes intersect.
You can benchmark your own turnover and tenure against peers with similar size, geography, and channel mix. You can explore whether lenders with lower turnover show different pricing dispersion or different patterns in serving specific borrower segments. You can examine whether certain markets or business models are associated with better stability and more consistent outcomes.
The goal is not to declare that one level of turnover is universally right or wrong. Different strategies will tolerate different amounts of churn. The goal is to make the real story visible, so leaders can move beyond slogans and design recruitment, retention, training, and compliance programs that reflect the workforce they actually have.
In a world where borrowers are becoming more data-driven in their own decisions, lenders need to be equally data-driven about their own teams. Recognizing real-world turnover and designing a borrower experience that can survive it is a critical step.
If you’d like to see where your institution sits on this map, you have two straightforward options:
--> Start a free trial of HMDAVision and explore your own MLO turnover, tenure, and borrower patterns directly, or
--> Book a market intel consultation with Val Buresch, CMB, and we’ll walk through your benchmarks alongside peers and discuss what they suggest for your “recruit and retain” strategy.
HMDAVision provides the lens to see the real story clearly, and to move from “recruit and retain” as a mantra to a strategy grounded in measurable stability and a better borrower experience.
Learn what loan officer turnover is, how to calculate it from NMLS data, and why lenders must track it for effective loan officer recruitment and retention strategy.
Talk to almost any mortgage lender and the themes sound familiar.
“We’re always hiring.”
“We can’t keep top producers.”
“Our branches feel like revolving doors.”
Most of the industry advice lenders hear from vendors and consultants reinforces the same story. If you just recruit more top producers and find better ways to retain them, production will take care of itself. Recruit and retain.
The trouble is that many lenders follow this advice, invest heavily in recruiting and retention, and still feel like they are running in place. The sales force never quite feels stable. Branches go through repeated rebuilds. Leadership spends more time talking about headcount than about the borrower experience or long-term strategy.
At Polygon Research, when we look at the NMLS mortgage loan originator (MLO) licensing data we model in HMDAVision, we see the other side of this story. Underneath the production numbers, there is a lot of quiet churn. Teams that appear fully staffed on paper are constantly being reconstructed in the background. Recruitment is happening, but retention is not keeping pace.
That is what the recruitment and retention treadmill looks like from a data perspective.
Recruitment and retention alone cannot solve a problem that has never been clearly measured.
If your only view of the LO workforce is a headcount report and a production ranking, you never see the actual dynamics underneath. You know how many LOs you have today and who closed the most loans last quarter. You do not know how many people you had to hire to get there, how many left, or how long your loan officers typically stay before moving on.
In that environment, every new initiative is judged by feel. A new recruiter seems busy. A new compensation plan seems attractive. A new culture program seems well received. Yet the underlying pattern of exits and tenure may be unchanged. You may be pouring more and more effort into refilling the same seats.
This is why recruitment and retention can feel like a treadmill. Without metrics that describe turnover and tenure, it is almost impossible to tell whether you are building a more stable platform or simply moving faster to stay in the same place.
The missing lens is not another tactic. It is a clear, quantitative view of how often loan officers leave and how long they actually stay.
Loan officer turnover is a simple idea with powerful implications. It answers a straightforward question: what share of your LO workforce leaves in a typical year?
In HMDAVision, using NMLS MLO licensing data per lender, we first calculate the number of MLOs - an annualized average of the daily count of active MLOs by lender.
Note: Some individuals included in the MLO statistics may hold NMLS licenses through their employer for compliance or internal policy reasons, even if they do not actively originate loans.
We also calculate an annualized average of the daily tally of days employed per MLO per lender. This is the average MLO tenure. The sum of all terminations throughout the year divided by the average annual tenure, by lender, gives us this MLO Turnover rate per lender. Turnover rates over 100% are possible and could indicate a uni-directional downward employment change or a more choppy hiring/termination environment.
When we apply these measurements across retail independent mortgage bankers in HMDAVision, patterns emerge that rarely show up in standard production reports.
Filtering for the top 25 retail independent lenders, we often see average MLO tenure in the range of 2 to 6 years, combined with annual turnover rates between 3% and 58%. Many of these lenders have LO workforces where the typical LO stays only a few years and a significant share of the roster turns over every year.
Lenders with high MLO turnover rates effectively rebuild their sales forces at a rapid pace. Others show notably lower turnover and longer tenure, suggesting more stable teams even in volatile markets.
Here is a snapshot of a trend for the retail IMB segment's MLO Tenure and Turnover from 2020 through 2024.
We see that the tenure has increased slightly - from 3.5 years to 3.9 years, but the MLO turnover varied widely.
Turnover is paired with tenure. MLO tenure measures how long, in years, the average loan officer stays with a specific lender. A tenure of 3.9 years means the typical LO is with that institution for just under four years before terminating employment there.
Taken together, turnover and tenure give you a much more realistic picture than a static headcount. They show not just how many loan officers you have on a given date, but how stable or unstable that workforce is over time.
Retail Independent Lenders had an average 32% MLO turnover rate and a 3.9-year MLO average tenure in 2024. This means that in a typical year, about one in three MLOs left their positions, while the average MLO stayed with the company for just under four years before moving on.
Turnover is a metric rarely used in competitive analyses and mortgage strategic plans, but it shapes both production and the borrower experience.
A lender with moderate turnover and longer tenure tends to accumulate institutional knowledge. Loan officers understand the lender’s products, pricing posture, overlays, and risk appetite. They know the local markets, referral partners, and internal processes. When a borrower returns to refinance or buy a new home, there is a reasonable chance of working with the same LO or at least someone deeply familiar with the company’s way of doing business.
A lender with high turnover lives in a different reality. New LOs are continually onboarding and learning systems and policies in real time. Others are leaving, sometimes taking relationships with them. Branches go through repeated resets. Borrowers are more likely to encounter an LO who is still learning the lender’s pricing and credit culture, and who may not be there for the borrower’s next transaction.
At the same time, borrowers themselves are increasingly becoming less dependent on any single loan officer for information. Before they ever speak to an LO, many borrowers have already compared offers online, read articles and posts about fees, discount points, and lender credits, and in some cases asked AI tools whether a specific quote makes sense for their credit profile and down payment.
In this environment, high turnover and short tenure can introduce more variability in how products and costs are explained and how options are framed. Two borrowers with similar profiles may hear different stories depending on whether they happen to reach a seasoned LO or someone new to the organization. From a fair lending and consumer-protection standpoint, that inconsistency matters.
Turnover, in other words, has a direct line to the quality and consistency of the borrower experience, even if the topline production numbers look fine.
In our HMDAVision tool, we filtered the top 25 lenders in 2024 to compare their MLO Turnover rate with their Borrower Shopping Index (BSI). The institutions with the very highest MLO turnover also show some of the highest borrower shopping indices. For example, Newrez’s turnover is roughly 58%, and its borrowers withdraw or decline offers at a rate above 100% of closed loans.
At the same time, we see lenders with high shopping but low turnover, and vice versa, which tells us turnover is one part of the story, not the whole story. Product focus, pricing posture, and lead funnels all matter too.
All of this does not mean recruitment and retention are unimportant. They remain essential parts of running a mortgage business. But it does mean that a “recruit and retain” playbook is not enough on its own.
Once you see your true turnover and tenure profile, the conversation changes. Recruitment is no longer just “hire more top producers”; it becomes “hire in a way that makes sense given how quickly people move in and out of our organization.” Retention is no longer “do something to keep everyone”; it becomes “identify where longer tenure is most critical for the borrower experience and for risk, and focus our efforts there.”
A lender with high turnover in certain segments or geographies may decide that the real priority is stabilizing those teams, not just adding more people into the funnel. A lender with unusually strong tenure in specific markets may want to understand what is working there and replicate those conditions elsewhere.
With turnover and tenure in view, “recruit and retain” stops being a one-sided slogan and becomes part of a broader, more realistic strategy. Instead of trying to outrun churn, leadership can design a model that anticipates movement in the LO workforce and builds a borrower experience resilient enough to withstand it.
At that point, the key question is no longer whether turnover matters, but where your own organization actually stands.
This is exactly why we brought NMLS data and modeled these metrics for MLO turnover and tenure into HMDAVision alongside HMDA loan-level data.
HMDAVision allows you to see, for each lender:
These MLO statistics live next to detailed information about loan volumes, pricing, borrower characteristics, product mix, and borrower shopping behavior. That combination gives you a more complete view of how human capital and borrower outcomes intersect.
You can benchmark your own turnover and tenure against peers with similar size, geography, and channel mix. You can explore whether lenders with lower turnover show different pricing dispersion or different patterns in serving specific borrower segments. You can examine whether certain markets or business models are associated with better stability and more consistent outcomes.
The goal is not to declare that one level of turnover is universally right or wrong. Different strategies will tolerate different amounts of churn. The goal is to make the real story visible, so leaders can move beyond slogans and design recruitment, retention, training, and compliance programs that reflect the workforce they actually have.
In a world where borrowers are becoming more data-driven in their own decisions, lenders need to be equally data-driven about their own teams. Recognizing real-world turnover and designing a borrower experience that can survive it is a critical step.
If you’d like to see where your institution sits on this map, you have two straightforward options:
--> Start a free trial of HMDAVision and explore your own MLO turnover, tenure, and borrower patterns directly, or
--> Book a market intel consultation with Val Buresch, CMB, and we’ll walk through your benchmarks alongside peers and discuss what they suggest for your “recruit and retain” strategy.
HMDAVision provides the lens to see the real story clearly, and to move from “recruit and retain” as a mantra to a strategy grounded in measurable stability and a better borrower experience.