.jpg)
In mortgage lending, few details are as fundamental as how you intend to occupy the property you're financing. This single data point classifying a home as a Primary Residence, Second Home, or Investment Property ripples through every stage of the loan process, from pricing and underwriting to risk assessment.
While it may seem straightforward, the distinction is critical. Getting it wrong, intentionally or not, can have serious consequences. To understand why, we need to look at the landscape from a lender's perspective. It all comes down to risk, and the data tells a compelling story.
Lenders sort properties into three buckets based on how the borrower will use them. These definitions are guided by industry standards, such as those set by investors like Fannie Mae, to ensure loans are classified correctly.
It’s helpful to understand the scale of each market segment. Based on 2024 data for 1-4 unit home purchase mortgages, adavilable in Polygon Vision, the market is overwhelmingly dominated by financing for primary residences. Here is the breakdown:
In 2024 alone, 3,096,526 loans were originated, totaling $1.143 trillion in volume of loans backed by Primary Residences. Investment Properties generated 315,512 loans, creating a $98 billion market. Second Homes are the smallest segment - with 89,675 loans originated, and $45 billion in volume.
Clearly, the incentives, risks, and borrower profiles for these three tiers are fundamentally different.
Lenders use occupancy type as a primary indicator of risk. The logic is simple: a borrower is least likely to default on the mortgage for the roof over their own head. The data shows precisely how this perceived risk translates into different loan terms.
The most direct way lenders price for risk is through the interest rate. The higher the perceived risk of default, the higher the rate.
The data for 2024 home purchase loans is unequivocal. In the bar chart below, we show the distribution of average interest rate by occupancy type and by year. Interest rates on Investment Properties are always the highest.
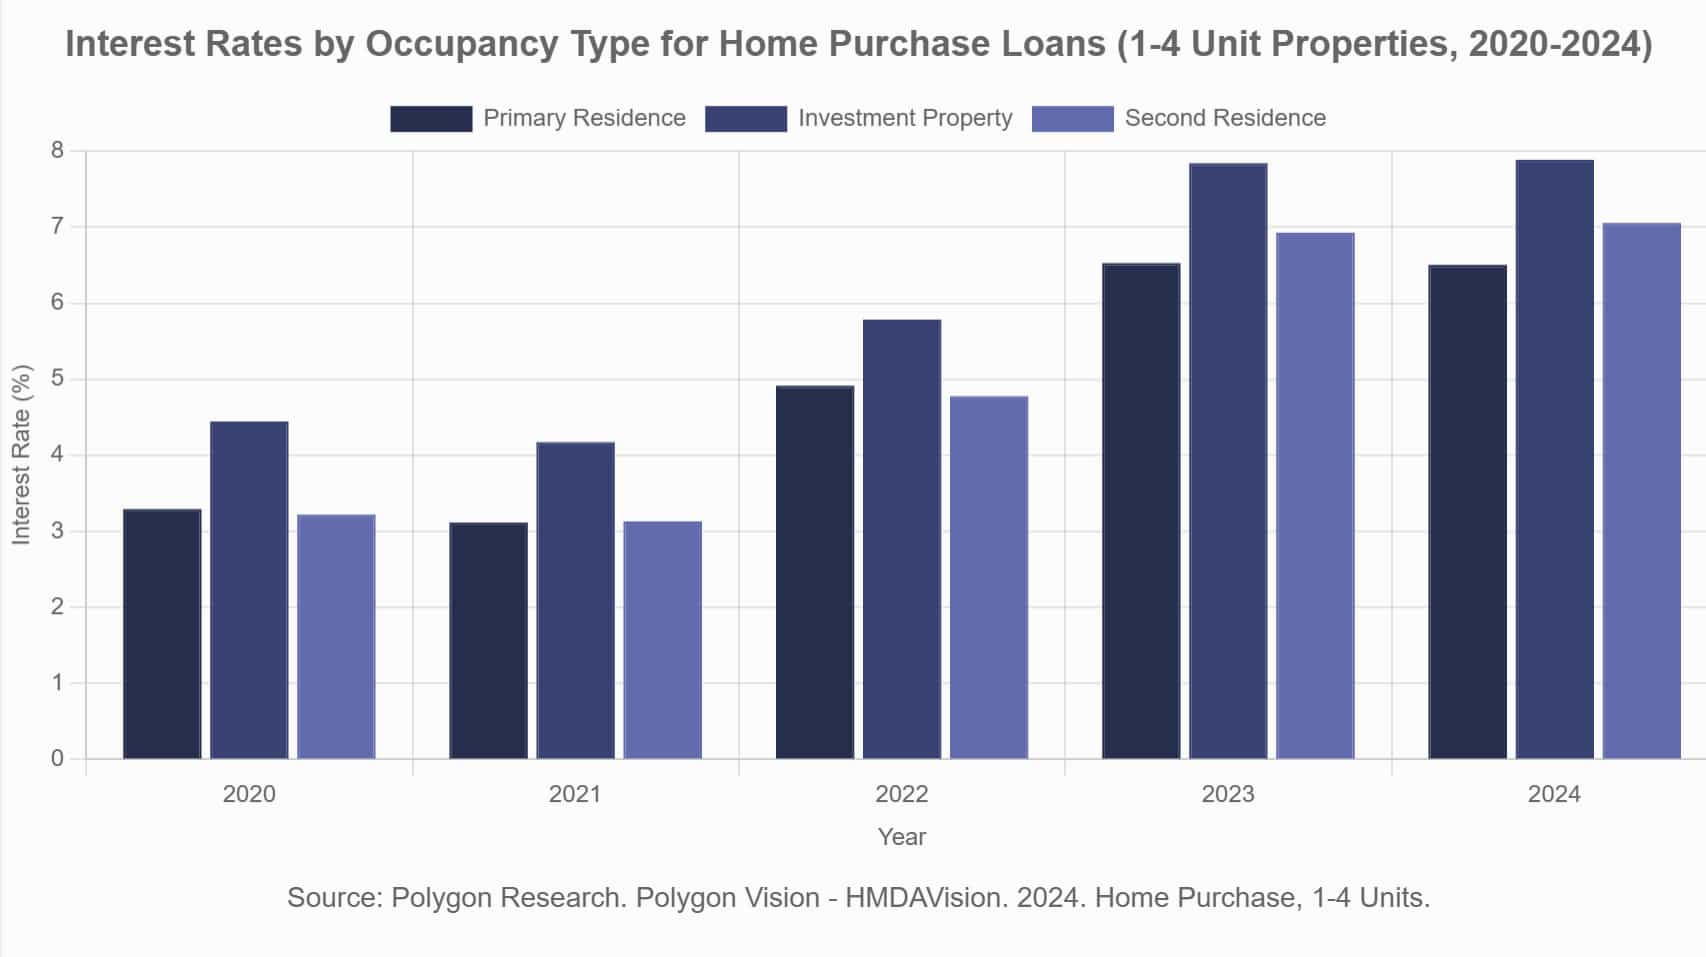
That nearly 140-basis-point spread between a primary home and an investment property (in 2024) can translate to hundreds of dollars a month and tens of thousands of dollars over the life of the loan. When we look at the comparison between average interest rates in first vs. second lien, there's more nuance. It moves beyond a simple market average to reveal how lenders are actively pricing for risk across different segments. See the latest 2024 data for yourself in our chart with analysis of the average interest rate distribution by Occupancy Type and Lien Status here.
Lenders mitigate risk by requiring borrowers to have more of their own capital invested, or "skin in the game", for riskier properties. This is measured by the Combined Loan-to-Value (CLTV) ratio. A lower CLTV means a larger down payment.
The data shows a clear risk-based approach, regardless of the year or origination of such loans. See our analysis of distribution of average CLTV by Occupancy Type and Year.
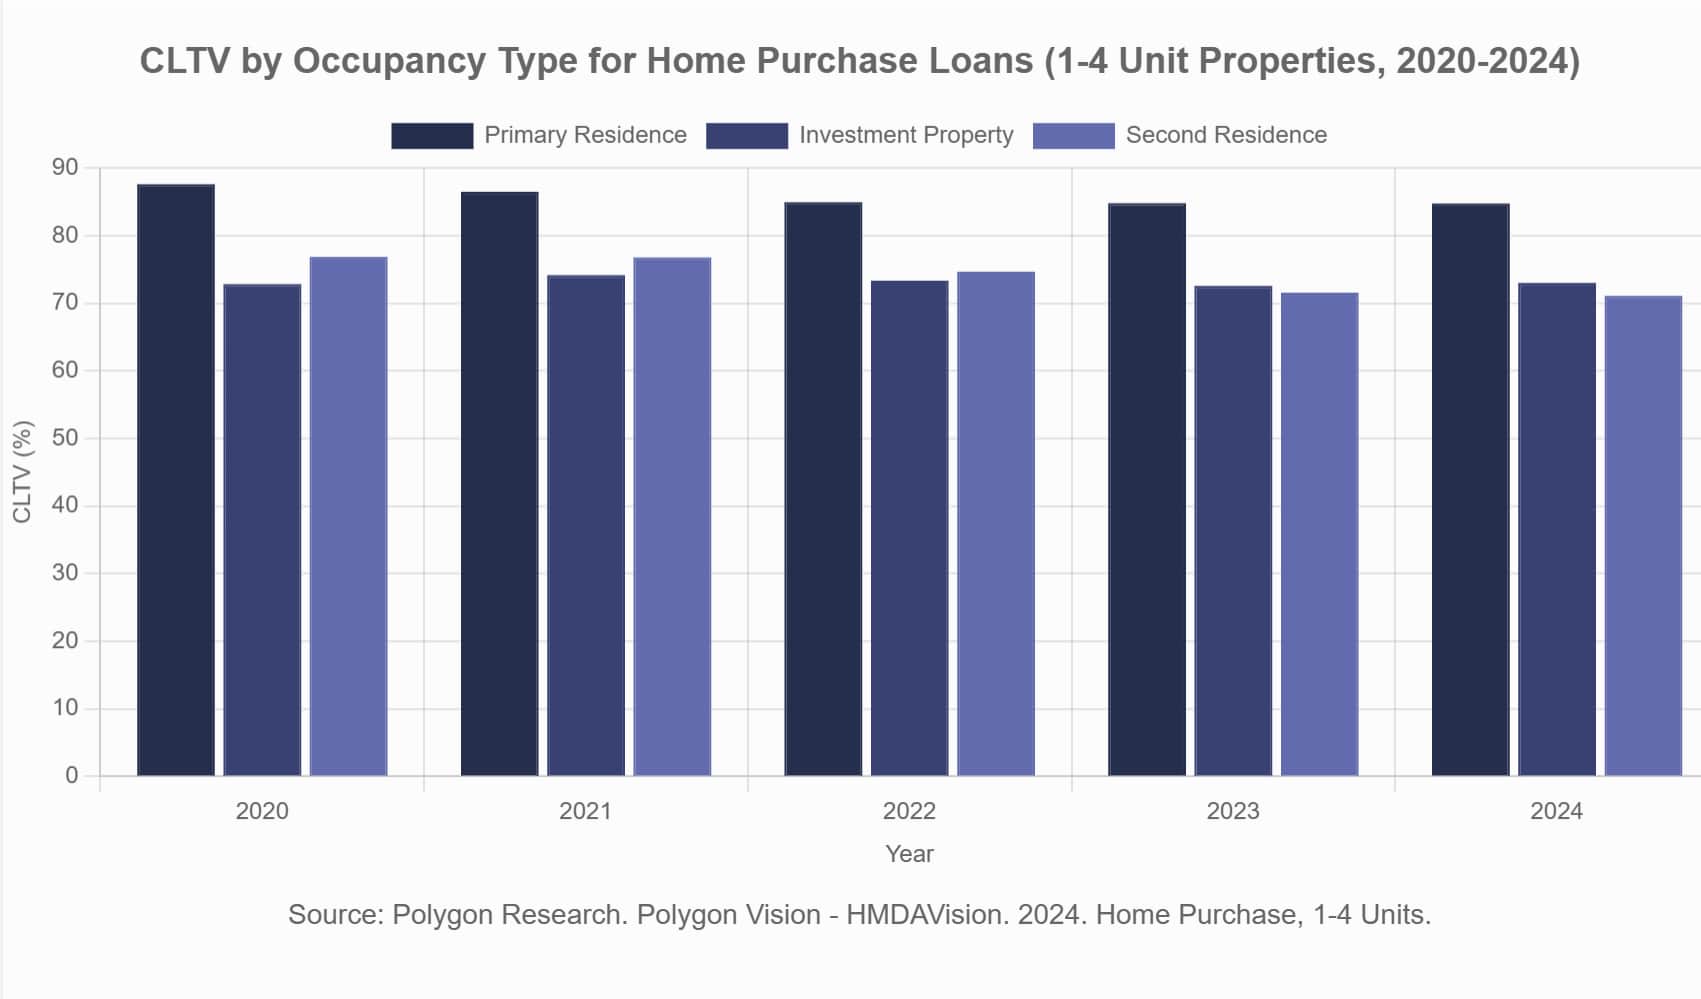
Primary Residence average CLTV is 84.6%. This means that down payments can be relatively low. For second homes and investment properties, lenders typically require a down payment of 25% or more, creating a significant equity cushion should the borrower default.
The data also paints a picture of the typical borrower for each occupancy type. As one would expect, purchasing additional properties requires greater financial resources.
Buyers of second homes and investment properties have markedly higher average incomes. The average applicant income for a second home purchase is over $481,000, compared to just $151,000 for a primary residence. This reflects the reality that owning multiple properties is a financial luxury. Correspondingly, second homes have the highest median property value at $485,000, suggesting they are often located in desirable vacation or luxury markets.
Given the significant financial advantages of financing a property as a primary residence, the temptation to misclassify a second home or investment property is real. Doing so is known as occupancy fraud.
Lenders don't treat this as a minor infraction. It is a form of material misrepresentation because the lender has based the loan's terms and pricing on a false, lower-risk profile. If the loan defaults, the lender's losses are likely to be higher than anticipated.
The consequences for a borrower caught committing occupancy fraud can be severe, including acceleration of the loan, meaning the full balance becomes immediately due; civil penalties and fines; and in serious cases, criminal charges.
Lenders and regulators actively monitor for this. Red flags include purchasing a "primary residence" a great distance from the borrower's place of employment or buying a supposed "second home" in the same city as the primary residence.
Occupancy status is a cornerstone of mortgage underwriting for a simple reason: it is one of the most reliable indicators of risk. The data clearly shows how this risk is priced into every loan through interest rates and down payment requirements.
For lenders, investors, and regulators trying to understand market dynamics, this data is invaluable.
But knowing the "what" only gets you so far. The real question is, what can you do with that knowledge?
If the answer isn't an immediate "yes," you're operating with incomplete intelligence. Polygon Vision, our bundle of HMDAVision and CensusVision tools, is built to answer these questions. It connects the loan to the community, giving you the clarity needed for sharp, decisive action.
Gain the strategic edge. Discover what's possible with Polygon Vision.
Primary, second, or investment? See how mortgage occupancy impacts interest rates and LTVs. Get a data-driven breakdown of this crucial loan classification.
In mortgage lending, few details are as fundamental as how you intend to occupy the property you're financing. This single data point classifying a home as a Primary Residence, Second Home, or Investment Property ripples through every stage of the loan process, from pricing and underwriting to risk assessment.
While it may seem straightforward, the distinction is critical. Getting it wrong, intentionally or not, can have serious consequences. To understand why, we need to look at the landscape from a lender's perspective. It all comes down to risk, and the data tells a compelling story.
Lenders sort properties into three buckets based on how the borrower will use them. These definitions are guided by industry standards, such as those set by investors like Fannie Mae, to ensure loans are classified correctly.
It’s helpful to understand the scale of each market segment. Based on 2024 data for 1-4 unit home purchase mortgages, adavilable in Polygon Vision, the market is overwhelmingly dominated by financing for primary residences. Here is the breakdown:
In 2024 alone, 3,096,526 loans were originated, totaling $1.143 trillion in volume of loans backed by Primary Residences. Investment Properties generated 315,512 loans, creating a $98 billion market. Second Homes are the smallest segment - with 89,675 loans originated, and $45 billion in volume.
Clearly, the incentives, risks, and borrower profiles for these three tiers are fundamentally different.
Lenders use occupancy type as a primary indicator of risk. The logic is simple: a borrower is least likely to default on the mortgage for the roof over their own head. The data shows precisely how this perceived risk translates into different loan terms.
The most direct way lenders price for risk is through the interest rate. The higher the perceived risk of default, the higher the rate.
The data for 2024 home purchase loans is unequivocal. In the bar chart below, we show the distribution of average interest rate by occupancy type and by year. Interest rates on Investment Properties are always the highest.
That nearly 140-basis-point spread between a primary home and an investment property (in 2024) can translate to hundreds of dollars a month and tens of thousands of dollars over the life of the loan. When we look at the comparison between average interest rates in first vs. second lien, there's more nuance. It moves beyond a simple market average to reveal how lenders are actively pricing for risk across different segments. See the latest 2024 data for yourself in our chart with analysis of the average interest rate distribution by Occupancy Type and Lien Status here.
Lenders mitigate risk by requiring borrowers to have more of their own capital invested, or "skin in the game", for riskier properties. This is measured by the Combined Loan-to-Value (CLTV) ratio. A lower CLTV means a larger down payment.
The data shows a clear risk-based approach, regardless of the year or origination of such loans. See our analysis of distribution of average CLTV by Occupancy Type and Year.
Primary Residence average CLTV is 84.6%. This means that down payments can be relatively low. For second homes and investment properties, lenders typically require a down payment of 25% or more, creating a significant equity cushion should the borrower default.
The data also paints a picture of the typical borrower for each occupancy type. As one would expect, purchasing additional properties requires greater financial resources.
Buyers of second homes and investment properties have markedly higher average incomes. The average applicant income for a second home purchase is over $481,000, compared to just $151,000 for a primary residence. This reflects the reality that owning multiple properties is a financial luxury. Correspondingly, second homes have the highest median property value at $485,000, suggesting they are often located in desirable vacation or luxury markets.
Given the significant financial advantages of financing a property as a primary residence, the temptation to misclassify a second home or investment property is real. Doing so is known as occupancy fraud.
Lenders don't treat this as a minor infraction. It is a form of material misrepresentation because the lender has based the loan's terms and pricing on a false, lower-risk profile. If the loan defaults, the lender's losses are likely to be higher than anticipated.
The consequences for a borrower caught committing occupancy fraud can be severe, including acceleration of the loan, meaning the full balance becomes immediately due; civil penalties and fines; and in serious cases, criminal charges.
Lenders and regulators actively monitor for this. Red flags include purchasing a "primary residence" a great distance from the borrower's place of employment or buying a supposed "second home" in the same city as the primary residence.
Occupancy status is a cornerstone of mortgage underwriting for a simple reason: it is one of the most reliable indicators of risk. The data clearly shows how this risk is priced into every loan through interest rates and down payment requirements.
For lenders, investors, and regulators trying to understand market dynamics, this data is invaluable.
But knowing the "what" only gets you so far. The real question is, what can you do with that knowledge?
If the answer isn't an immediate "yes," you're operating with incomplete intelligence. Polygon Vision, our bundle of HMDAVision and CensusVision tools, is built to answer these questions. It connects the loan to the community, giving you the clarity needed for sharp, decisive action.
Gain the strategic edge. Discover what's possible with Polygon Vision.