To a mortgage professional, the Loan-Level Price Adjustment (LLPA) matrix is a daily fact of life. LLPAs are pricing adjustments "assessed based upon certain eligibility or other loan features... such as credit score, loan purpose, occupancy, number of units, product type, etc."
In the simplest terms, the LLPA matrix is a risk-based pricing grid published by Fannie Mae and Freddie Mac, under the direction of their conservator, the FHFA. As Fannie Mae defines it, LLPAs are pricing adjustments "assessed based upon certain eligibility or other loan features... such as credit score, loan purpose, occupancy, number of units, product type, etc."
It's the rulebook. A high-LTV loan or a lower credit score carries more risk, so it gets a pricing "hit." A low-LTV loan with a high FICO score gets a waiver or a credit.
But here’s the problem: The official LLPA matrix is just a price list. It’s a map of possible roads, but it doesn't tell you where a single car is driving. In the current high-interest rate environment, successful mortgage origination hinges on two factors: understanding where market volume is concentrated and efficiently managing the risk-based pricing mechanisms that dictate loan profitability. LLPAs are crucial to this equation, serving as mandatory, risk-based fees that adjust the cost of conventional mortgages based on loan characteristics like credit score and LTV ratio.
At Polygon Research, we believe that knowing the rules is basic, but knowing how the game is actually played is strategic. To find out, we analyzed the 1,063,190 conventional fixed rate agency mortgage originations from 2025 year-to-date (through September 2025), asking a simple question: "Where are these loans actually landing?"
We mapped all 784,219 purchase loans, 174,487 cash-out refinances, and 103,615 rate & term refinances onto the FICO-vs-CLTV grid. (This analysis focuses on the core conventional market, excluding niche and affordable products like HFA, Home Ready/Home Possible, rural, and HUD Section 184 loans.)
The result is not an even spread. It’s a stunning landscape of massive, concentrated "hot zones" and vast, empty "deserts." This is the real map of the 2025 mortgage market.
The purchase market is the engine of the industry, and our 2025 YTD data shows it's running on two parallel cylinders. We found two massive, distinct concentrations of activity at the "20% down" and the "5% down" loans.
The "20% Down" Loans
The single largest cohort of buyers remains the "traditional" borrower. One in four purchase loans landed in the 75.01% to 80% CLTV bucket 2025 YTD. These are the 20% down payment buyers.
The "5% Down" Loans
This is the most compelling story from the data. The 90.01% to 95% CLTV bucket (representing 5% down payments) is not a niche product. It accounts for 20.0% of all conventional purchase loans, making it the second-largest tier in the entire market.

But here is the critical strategic insight: this high-LTV lending is "fortified" by pristine credit.
This isn't the high-LTV lending of the past. Our analysis shows that 74% of all purchase borrowers in 2025 had a credit score of 740 or higher.
The market has clearly solved for risk. The high-LTV 5% down payment is a core component of the modern housing market, but it’s being enabled almost exclusively for borrowers with excellent credit. The riskiest parts of the grid, low credit score and high CLTV, are virtually empty.
Given the 2025 rate environment, it's no surprise that the refinance market is much smaller than the purchase market. 2025 YTD there are 278,131 conventional fixed rate mortgages, of which 63% are cash-out refinance and 37% are rate and term refinance loans.
Again, we looked at the distribution of cash-out refinance loans in an LLPA-like matrix to see where are those loans falling into. But before we continue it's worth pausing and defining what do we mean by cash-out refinance loan sold to Fannie Mae and Freddie Mac. A Fannie Mae cash-out refinance loan is a conventional mortgage refinancing option, which enables eligible homeowners to replace their existing mortgage with a new one for a larger principal amount, essentially accessing a portion of their home equity in the form of cash disbursed at closing. The funds obtained may be applied toward various purposes, such as home improvements, debt consolidation, educational expenses, or other financial needs, subject to lender and regulatory guidelines.
Below is the LLPA-like matrix that maps the distribution of these loans by risk layer. The maximum threshold for LTV is 80%.
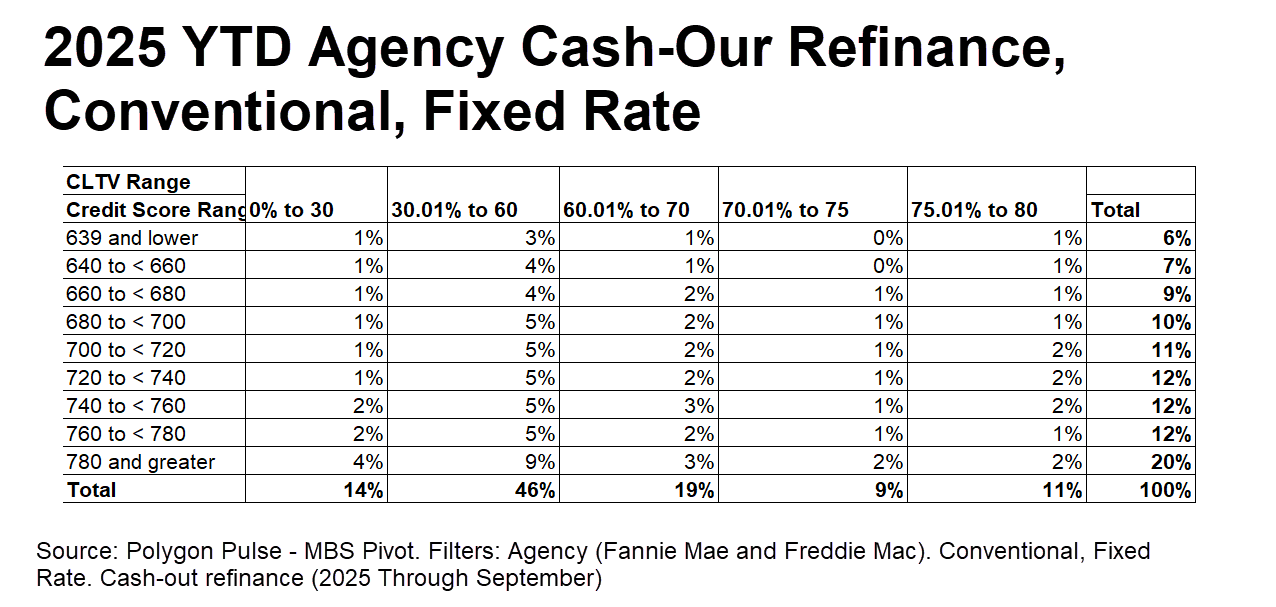
The 2025 cash-out refinance borrower is, in a word, fairly safe. This market is dominated by borrowers with massive equity cushions and great credit.
60% of all cash-out loans have a CLTV of 60% or less. Over half of all borrowers (52.2%) have a credit score of 740 or higher.
The GSEs and lenders are not taking on significant risk here. This is a product for the most well-qualified homeowners to tap into their equity.
Last month, we tackled the streamline refinance opportunity with FHA loans. But today we focus on the Rate & Term (R/T) refinance Conventional market, which happens to be the smallest of the three market segments we discuss in our blog (Cash-Out, Purchase, and R/T), and its profile is the most pristine in 2025. These are the "best of the best" borrowers.

A staggering 73% of all R/T refi borrowers have a FICO score of 740 or higher. The largest single CLTV bucket is 30.01% to 60% (30.6%). This is a market for borrowers with exceptional qualifications.
What is an LLPA? And where are 2025's conventional loans actually landing?
To a mortgage professional, the Loan-Level Price Adjustment (LLPA) matrix is a daily fact of life. LLPAs are pricing adjustments "assessed based upon certain eligibility or other loan features... such as credit score, loan purpose, occupancy, number of units, product type, etc."
In the simplest terms, the LLPA matrix is a risk-based pricing grid published by Fannie Mae and Freddie Mac, under the direction of their conservator, the FHFA. As Fannie Mae defines it, LLPAs are pricing adjustments "assessed based upon certain eligibility or other loan features... such as credit score, loan purpose, occupancy, number of units, product type, etc."
It's the rulebook. A high-LTV loan or a lower credit score carries more risk, so it gets a pricing "hit." A low-LTV loan with a high FICO score gets a waiver or a credit.
But here’s the problem: The official LLPA matrix is just a price list. It’s a map of possible roads, but it doesn't tell you where a single car is driving. In the current high-interest rate environment, successful mortgage origination hinges on two factors: understanding where market volume is concentrated and efficiently managing the risk-based pricing mechanisms that dictate loan profitability. LLPAs are crucial to this equation, serving as mandatory, risk-based fees that adjust the cost of conventional mortgages based on loan characteristics like credit score and LTV ratio.
At Polygon Research, we believe that knowing the rules is basic, but knowing how the game is actually played is strategic. To find out, we analyzed the 1,063,190 conventional fixed rate agency mortgage originations from 2025 year-to-date (through September 2025), asking a simple question: "Where are these loans actually landing?"
We mapped all 784,219 purchase loans, 174,487 cash-out refinances, and 103,615 rate & term refinances onto the FICO-vs-CLTV grid. (This analysis focuses on the core conventional market, excluding niche and affordable products like HFA, Home Ready/Home Possible, rural, and HUD Section 184 loans.)
The result is not an even spread. It’s a stunning landscape of massive, concentrated "hot zones" and vast, empty "deserts." This is the real map of the 2025 mortgage market.
The purchase market is the engine of the industry, and our 2025 YTD data shows it's running on two parallel cylinders. We found two massive, distinct concentrations of activity at the "20% down" and the "5% down" loans.
The "20% Down" Loans
The single largest cohort of buyers remains the "traditional" borrower. One in four purchase loans landed in the 75.01% to 80% CLTV bucket 2025 YTD. These are the 20% down payment buyers.
The "5% Down" Loans
This is the most compelling story from the data. The 90.01% to 95% CLTV bucket (representing 5% down payments) is not a niche product. It accounts for 20.0% of all conventional purchase loans, making it the second-largest tier in the entire market.
But here is the critical strategic insight: this high-LTV lending is "fortified" by pristine credit.
This isn't the high-LTV lending of the past. Our analysis shows that 74% of all purchase borrowers in 2025 had a credit score of 740 or higher.
The market has clearly solved for risk. The high-LTV 5% down payment is a core component of the modern housing market, but it’s being enabled almost exclusively for borrowers with excellent credit. The riskiest parts of the grid, low credit score and high CLTV, are virtually empty.
Given the 2025 rate environment, it's no surprise that the refinance market is much smaller than the purchase market. 2025 YTD there are 278,131 conventional fixed rate mortgages, of which 63% are cash-out refinance and 37% are rate and term refinance loans.
Again, we looked at the distribution of cash-out refinance loans in an LLPA-like matrix to see where are those loans falling into. But before we continue it's worth pausing and defining what do we mean by cash-out refinance loan sold to Fannie Mae and Freddie Mac. A Fannie Mae cash-out refinance loan is a conventional mortgage refinancing option, which enables eligible homeowners to replace their existing mortgage with a new one for a larger principal amount, essentially accessing a portion of their home equity in the form of cash disbursed at closing. The funds obtained may be applied toward various purposes, such as home improvements, debt consolidation, educational expenses, or other financial needs, subject to lender and regulatory guidelines.
Below is the LLPA-like matrix that maps the distribution of these loans by risk layer. The maximum threshold for LTV is 80%.
The 2025 cash-out refinance borrower is, in a word, fairly safe. This market is dominated by borrowers with massive equity cushions and great credit.
60% of all cash-out loans have a CLTV of 60% or less. Over half of all borrowers (52.2%) have a credit score of 740 or higher.
The GSEs and lenders are not taking on significant risk here. This is a product for the most well-qualified homeowners to tap into their equity.
Last month, we tackled the streamline refinance opportunity with FHA loans. But today we focus on the Rate & Term (R/T) refinance Conventional market, which happens to be the smallest of the three market segments we discuss in our blog (Cash-Out, Purchase, and R/T), and its profile is the most pristine in 2025. These are the "best of the best" borrowers.
A staggering 73% of all R/T refi borrowers have a FICO score of 740 or higher. The largest single CLTV bucket is 30.01% to 60% (30.6%). This is a market for borrowers with exceptional qualifications.