Conventional Cash-Out Refi vs Purchase Channel Shares 2025 YTD
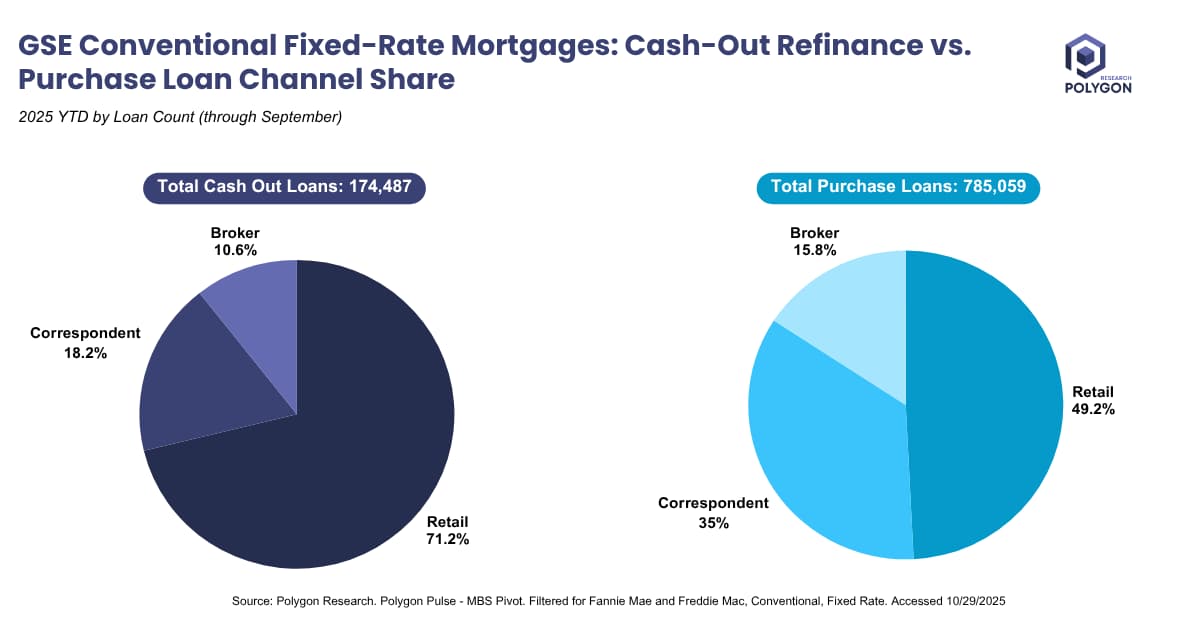
This chart compares origination channel shares for GSE conventional fixed-rate mortgages in 2025 YTD through September, segmented by cash-out refinances (174,487 loans) and purchases (785,059 loans). For cash-outs, retail channels lead at 71.2%, followed by correspondent (18.2%) and broker (10.6%). In contrast, purchases show a more balanced distribution: retail at 49.2%, correspondent at 35%, and broker at 15.8%.
The dominance of retail in cash-outs suggests lenders with direct consumer access excel in these refis amid elevated rates and home price appreciation. For purchases, higher correspondent and broker shares reflect strategies to capture competitive first-time buyer or relocation markets, where volume scales through partnerships.
Strategically, lenders can use this to benchmark performance. Retail-heavy firms should prioritize refi retention via targeted marketing, while diversifying into purchases via broker alliances. In a high-rate environment, this data aids risk management - cash-outs may carry higher default risks due to increased debt burdens. Stakeholders like investors can assess portfolio exposure, and policymakers gauge market health. Overall, it empowers data-driven channel optimization to boost profitability and market share.
From Analysis to Action
Ready to Continue? Get Your Exact Market Answers.
Start your 7-day free trial.