Credit Union Delinquency Rates by Lien Status Q2 2025
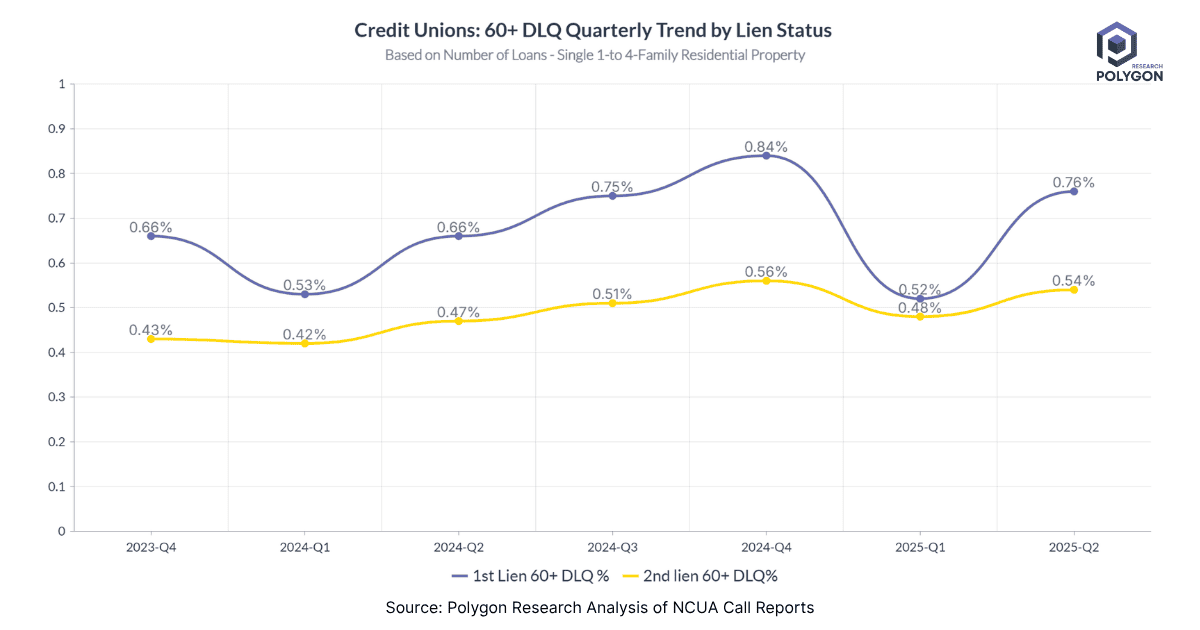
This chart, derived from NCUA Call Report data aggregated by Polygon Research, illustrates the quarterly trend for loans 60 or more days delinquent (60+ DLQ). Our analysis is based on the number of loans, not their dollar volume.
Analyzing delinquency by the number of loans gives you a direct measure of the number of borrowers and families in distress. Each loan represents a household. This insight is great for operations planning - it tells you how many collection calls to make, how many loss mitigation files to open, and how many borrowers need outreach. Servicing is a people-intensive operation, and loan counts directly translate to workload and staffing needs.
An analysis of delinquencies by loan count treats every loan equally, whether it's for $50,000 or $2 million. It prevents a few large, non-performing jumbo loans from skewing the overall delinquency rate, which gives a clearer picture of systemic stress across the CU membership.
A rising delinquency rate by loan count is a strong indicator of widespread economic hardship affecting a large portion of credit union members, rather than an isolated issue with a few high-value loans.
Dollar volume is critical for financial planning, such as setting loss reserves and managing capital.
From Analysis to Action
Ready to Continue? Get Your Exact Market Answers.
Start your 7-day free trial.