Top 10 Agency Mortgage Lenders: August 2025 YTD
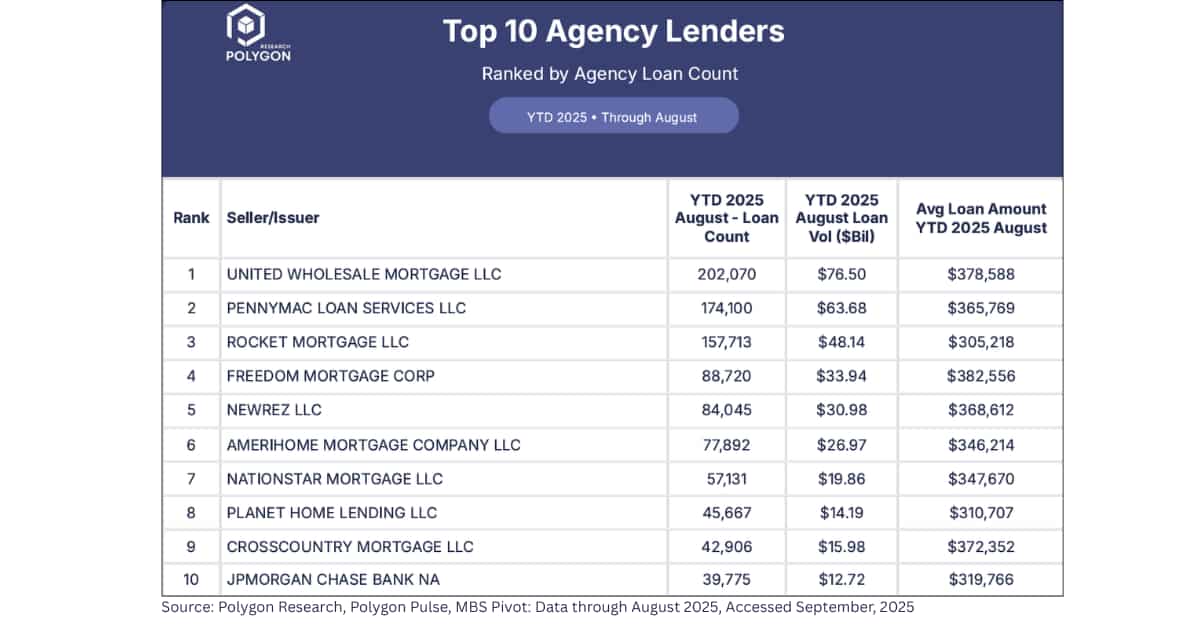
The August leaderboard ranks the top 10 agency lenders by loan count YTD through August 2025. UWM leads the pack in both loan count (202k) and volume ($76.5B), followed closely by PennyMac and Rocket Mortgage. However, a strategic divergence is clear in the average loan amounts. Rocket's average loan ($305k) is significantly below UWM's ($379k) and Freedom's ($383k). A lower average loan suggests a focus on refinances or lower-cost markets, while a higher average points to a purchase-heavy strategy in higher-cost areas. Clearly, market leadership isn't monolithic; scale is achieved through varied channels and product focuses.
How Decision-Makers Can Use This Data
Lenders can use this for competitive benchmarking to identify their market niche. This helps determine whether to compete in the high-volume, lower-balance space (like Rocket) or the higher-balance purchase market (like UWM). Lenders use these insights to inform product, channel (retail vs. wholesale), and geographic strategy.
Secondary market participants can better assess portfolio risk from these top sellers, influencing pricing.
Vendors can tailor sales strategies to fit each lender’s specific business model.
From Analysis to Action
Ready to Continue? Get Your Exact Market Answers.
Start your 7-day free trial.