Understanding FHA Rate Variations Across States: 2025 Insights
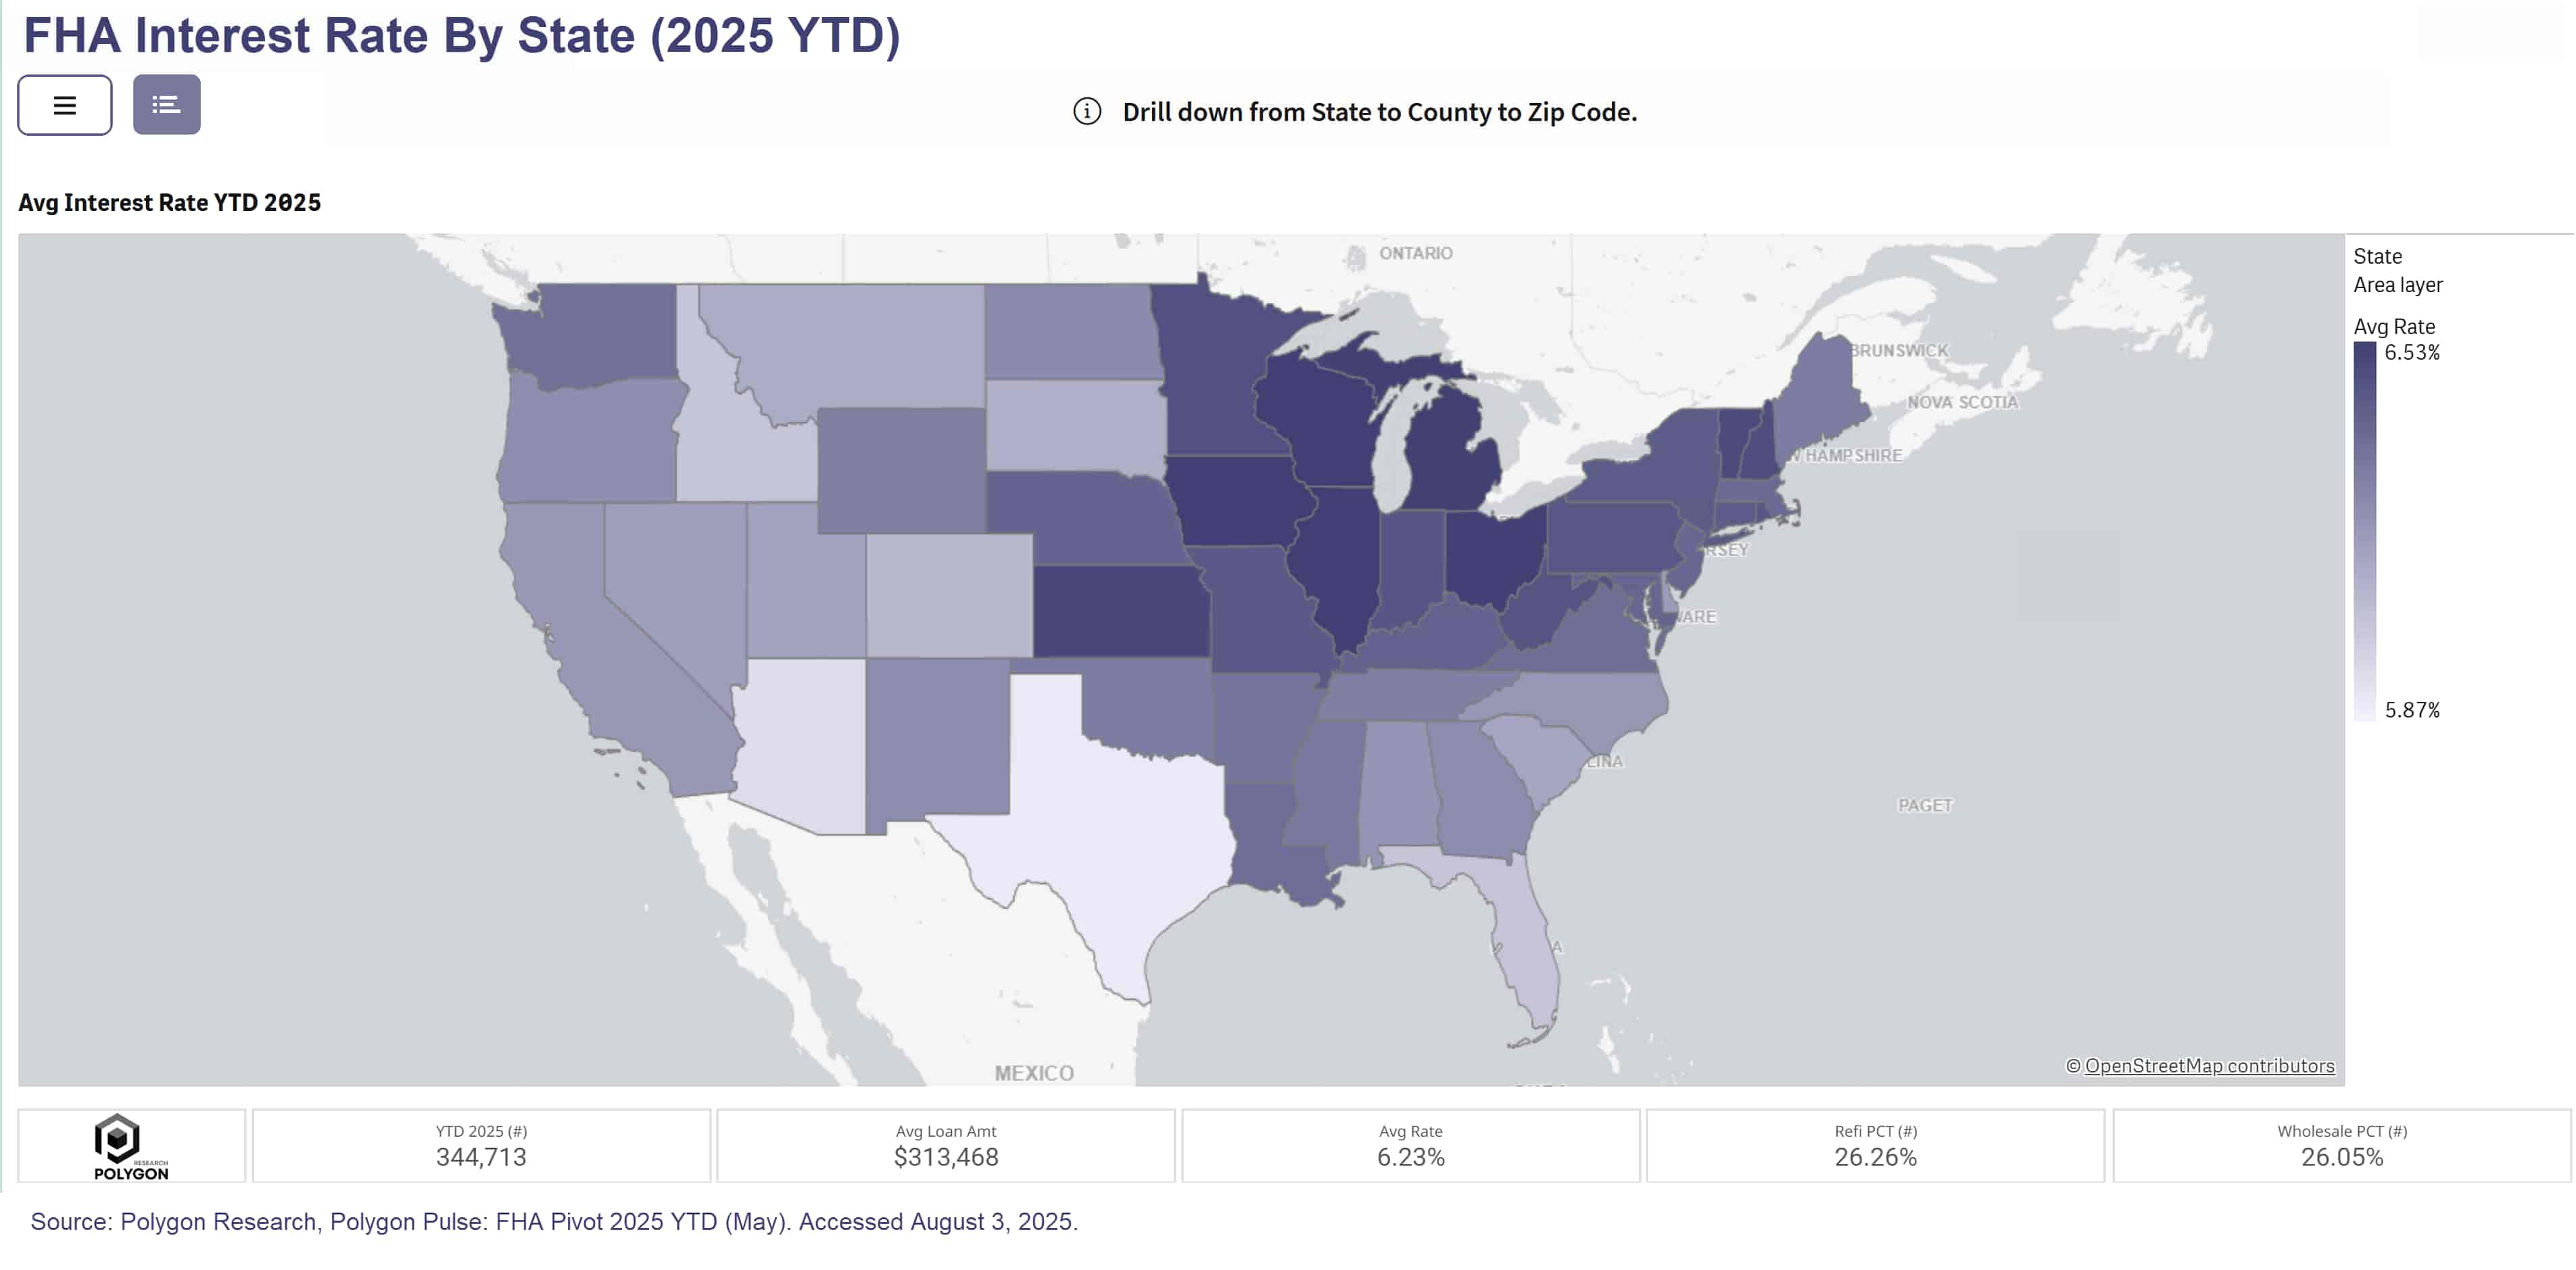
The FHA Interest Rates by State (2025 YTD) map shows rates ranging from below 6% in Texas to mid‑6% levels in Ohio and Illinois. These differences reflect local lending practices. In Texas, large builders frequently use rate buy-downs in sales contracts and loans through affiliated lenders or Joint Ventures, resulting in lower average rates that set local benchmarks. This pattern demonstrates how buydowns influence borrower costs and regional pricing, and ultimately, affordability.
For housing finance professionals, the data clarifies how market structures affect rate outcomes and credit access.
Nationally, FHA loans remain cheaper than conventional loans measured at note rate (before fees, points, and credits): 6.23% vs. 6.69% for all loan purposes. Understanding these variations aids in evaluating loan programs and competitive dynamics.
From Analysis to Action
Ready to Continue? Get Your Exact Market Answers.
Start your 7-day free trial.