.png)
Lenders and real estate professionals often use preapproval and prequal interchangeably, and the data to sort it out lives in too many places. Marketing says one thing, a template letter says another, LOS fields are inconsistent, and when you go hunting for a clean answer, it’s not obvious where to look. This post gives you a simple roadmap: what each term actually means, a quick example to anchor it, the 2024 data that shows why the difference matters (with a chart), and how to track the few metrics that tell the story.
Here’s the clean distinction:
True preapproval letters are conditioned only on property items (appraisal, title, etc.). If a letter still says “subject to income or assets,” it’s a prequal—no matter what the header claims.
Our 2024 mortgage market analysis (first-lien, home purchase; nationwide) shows that applications with a preapproval request are a small slice (about 5% of net applications) but they result in much higher origination rates: 94.7% vs. 81.4% when no preapproval is requested. These rates are calculated on Net Applications.
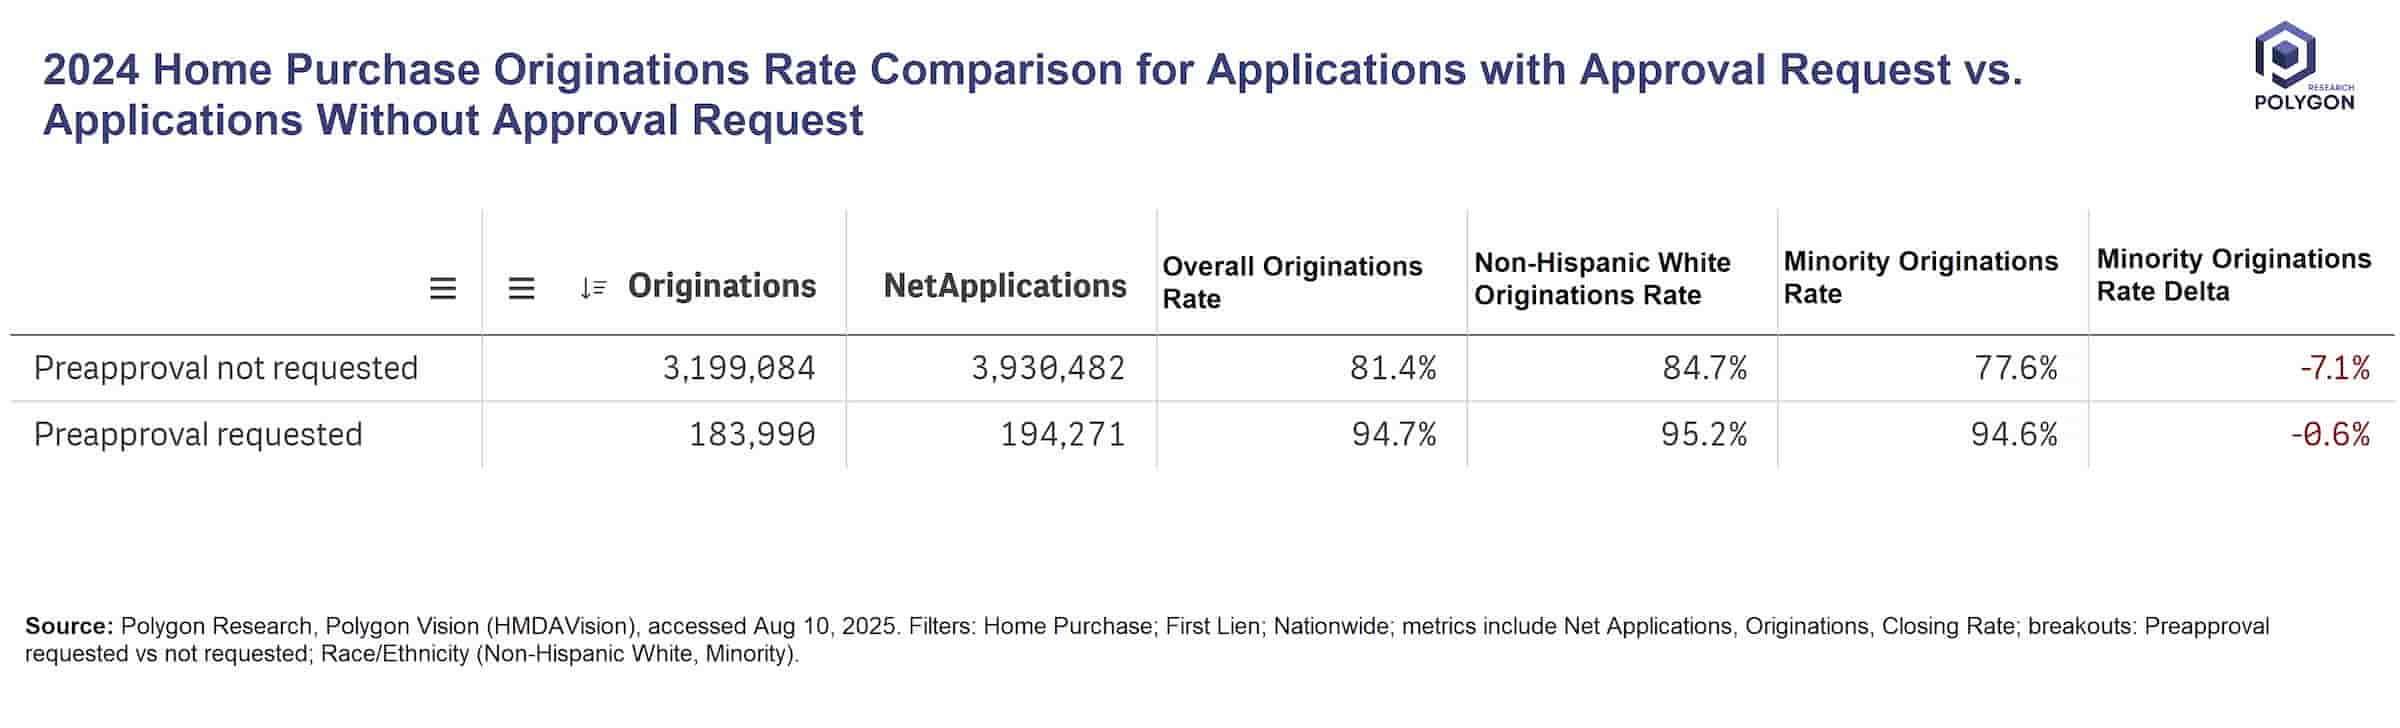
The approval gap by race/ethnicity also tightens with preapproval: 95.2% for Non-Hispanic White vs. 94.6% for minority borrowers (−0.6 pp), compared with 84.7% vs. 77.6% (−7.1 pp) without a preapproval request.
Does preapproval cause the lift? Not proven here. Selection effects are real - borrowers routed to preapproval may be stronger or simply better prepared. But the pattern lines up with intent: move the full decision earlier and you get more consistent outcomes.
For example, we look beyond Net Applications, and go deeper into the Total Applications with preapproval requests (first lien, home purchase). In 2024, there were 393,241 such home purchase applications, and 152,148 of these applications resulted in applicants not accepting these preapprovals.
Our role is to make this distinction measurable and comparable. With Polygon Vision, we stitch HMDA LAR and Census data to show, by market and peer set, how often preapproval is used, how it relates to origination rates, and how minority/Non-Hispanic White deltas move between the “preapproval requested” and “not requested” lanes. The chart above is the 30,000-foot view; we can run the same analysis for your footprint, channels, and competitors, then test whether routing more applicants to a true preapproval lane would improve results.
If your teams treat “preapproval” and “prequal” as synonyms, you’re flying blind, both in reporting and in strategy. Get the terms right, measure both lanes, and let the data show where to tune. When you’re ready to see your market through this lens, checkout your benchmarks in Polygon Vision.
Learn the difference between mortgage preapproval and prequalification. How preapprovals change mortgage origination rates and fair-lending gaps using 2024 data.
Lenders and real estate professionals often use preapproval and prequal interchangeably, and the data to sort it out lives in too many places. Marketing says one thing, a template letter says another, LOS fields are inconsistent, and when you go hunting for a clean answer, it’s not obvious where to look. This post gives you a simple roadmap: what each term actually means, a quick example to anchor it, the 2024 data that shows why the difference matters (with a chart), and how to track the few metrics that tell the story.
Here’s the clean distinction:
True preapproval letters are conditioned only on property items (appraisal, title, etc.). If a letter still says “subject to income or assets,” it’s a prequal—no matter what the header claims.
Our 2024 mortgage market analysis (first-lien, home purchase; nationwide) shows that applications with a preapproval request are a small slice (about 5% of net applications) but they result in much higher origination rates: 94.7% vs. 81.4% when no preapproval is requested. These rates are calculated on Net Applications.
The approval gap by race/ethnicity also tightens with preapproval: 95.2% for Non-Hispanic White vs. 94.6% for minority borrowers (−0.6 pp), compared with 84.7% vs. 77.6% (−7.1 pp) without a preapproval request.
Does preapproval cause the lift? Not proven here. Selection effects are real - borrowers routed to preapproval may be stronger or simply better prepared. But the pattern lines up with intent: move the full decision earlier and you get more consistent outcomes.
For example, we look beyond Net Applications, and go deeper into the Total Applications with preapproval requests (first lien, home purchase). In 2024, there were 393,241 such home purchase applications, and 152,148 of these applications resulted in applicants not accepting these preapprovals.
Our role is to make this distinction measurable and comparable. With Polygon Vision, we stitch HMDA LAR and Census data to show, by market and peer set, how often preapproval is used, how it relates to origination rates, and how minority/Non-Hispanic White deltas move between the “preapproval requested” and “not requested” lanes. The chart above is the 30,000-foot view; we can run the same analysis for your footprint, channels, and competitors, then test whether routing more applicants to a true preapproval lane would improve results.
If your teams treat “preapproval” and “prequal” as synonyms, you’re flying blind, both in reporting and in strategy. Get the terms right, measure both lanes, and let the data show where to tune. When you’re ready to see your market through this lens, checkout your benchmarks in Polygon Vision.