
FHA loans anchor the affordable lending ecosystem with a steady 17.4% of first-lien originations in 2024. While this footprint may appear modest, FHA activity serves as a remarkably sensitive gauge of affordability stress, borrower demographics, and competitive behavior throughout the housing finance industry. Our analysis of 2025 year-to-date data through May reveals geographic, institutional, and historical patterns that can inform strategic decision-making.
FHA interest rates vary meaningfully across states, ranging from below 6% in Texas to the mid-6% range in states like Ohio and Illinois. Texas stands out with 42,304 FHA endorsements in the first five months of 2025 and an average rate of 5.9%. This lower average rate reflects a systematic approach where large production builders routinely embed rate buy-downs in sales contracts and channel those loans through builder-affiliated lenders. This practice accelerates new-home sales while establishing local pricing benchmarks that influence broader market competition.
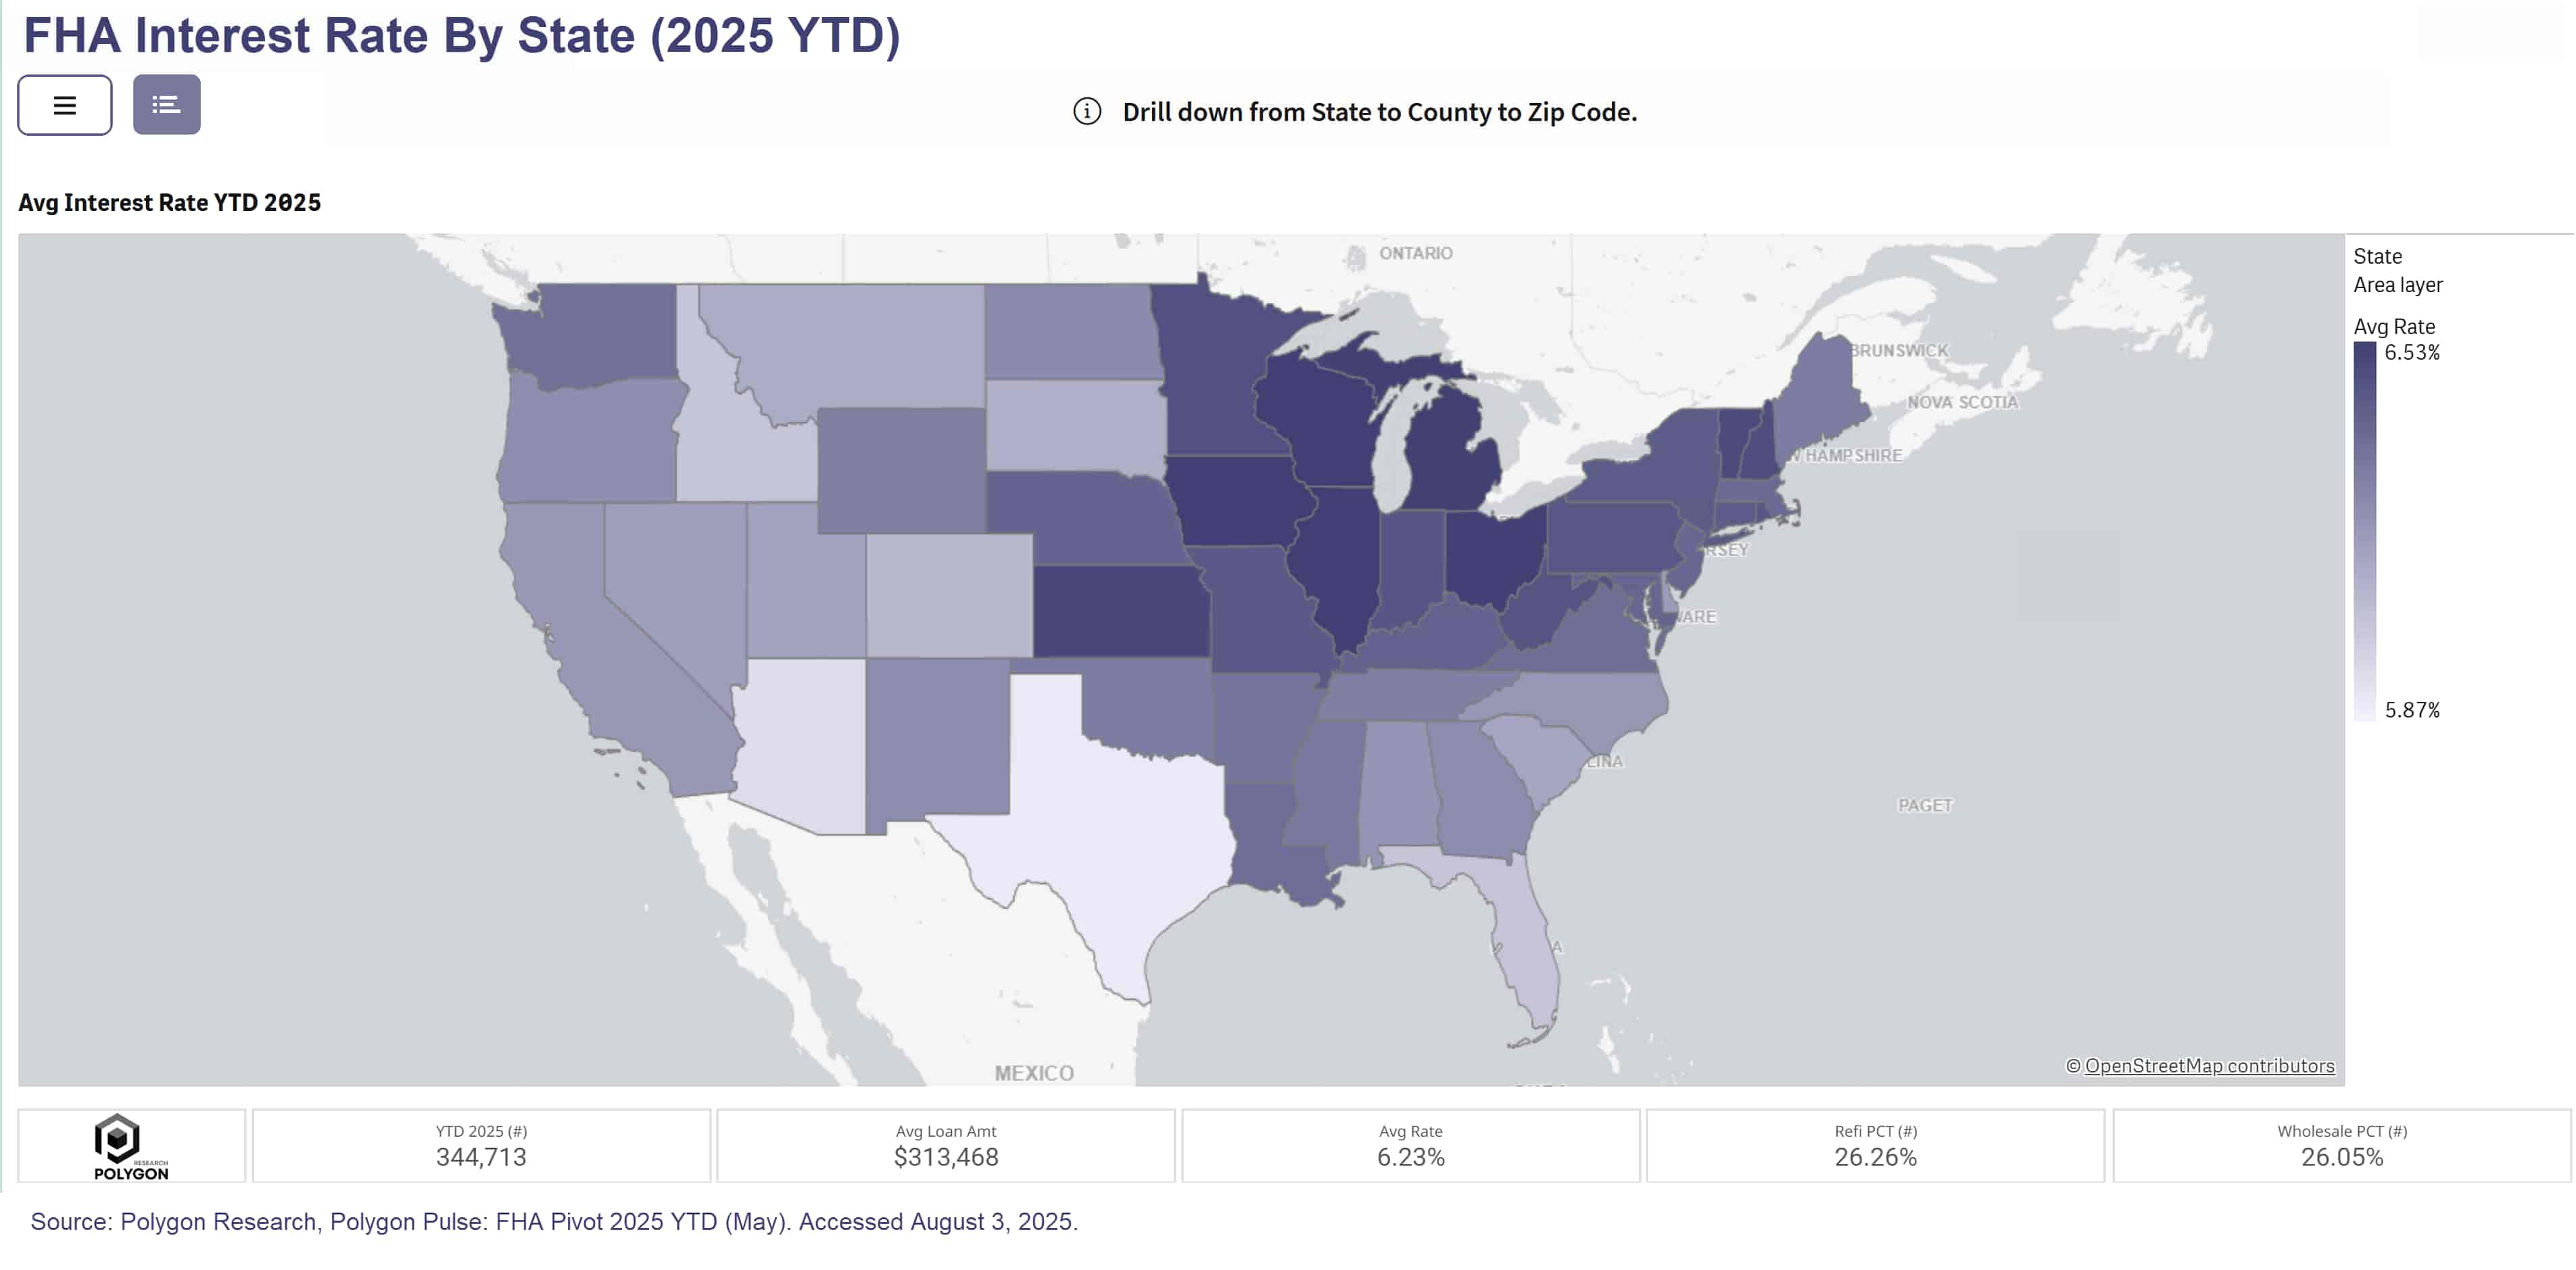
Interest rates exclude fees, points or lender credits.
Without filtering for loan purpose, the average interest rate of an FHA loan was 6.23% 2025YTD through May as we see in our analysis from FHA Pivot, compared to 6.69% across for conventional loans sold to Fannie Mae and Freddie Mac (MBS Pivot). Applying a loan purpose filter for purchase loans, the average interest rate for FHA purchase loan was 6.20% vs. 6.67% for a conventional purchase loan sold to the two GSEs.
The 2025 first-time buyer data provides useful context for strategic planning. Through June, the average first-time buyer using FHA borrowed approximately $321,000 at 6.23%, carried a 691 credit score, had a 45% debt-to-income ratio, and financed 97% of the purchase price. By comparison, conventional first-time buyers borrowed $385,000 at 6.66% with a 755 credit score, 37% debt-to-income ratio, and 83% loan-to-value ratio. We derive these metrics from our MBS Pivot (part of Polygon Pulse bundle of tools), which interactively analyzes agency origination dynamics across loan types and market segments.
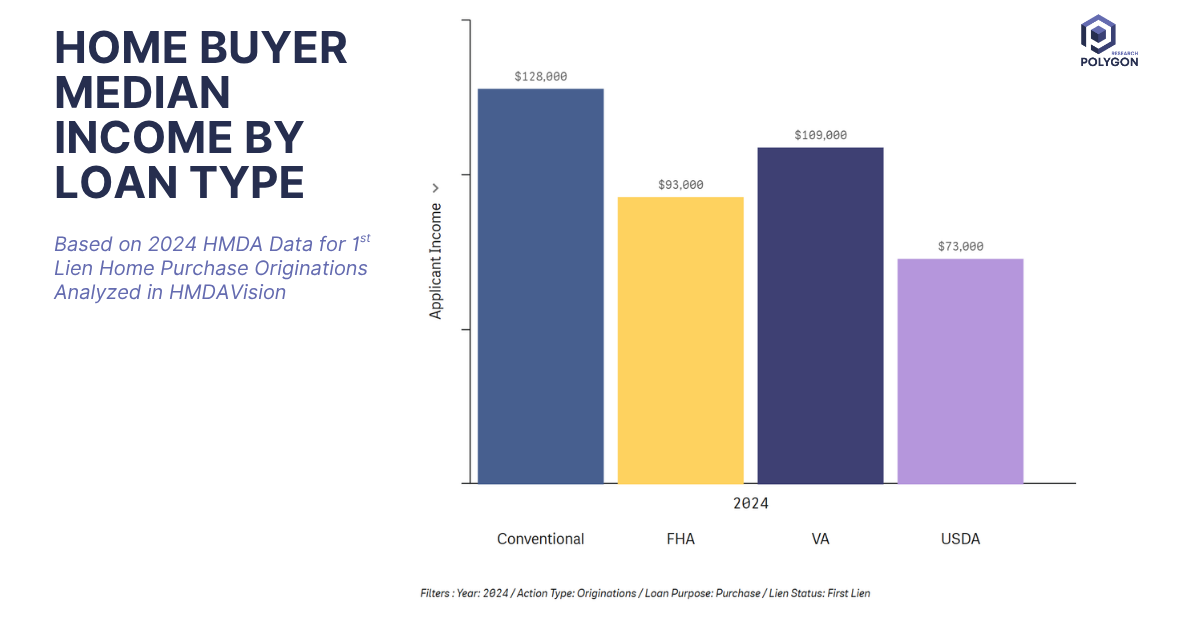
The income distribution data from our 2024 HMDA analysis in Polygon Vision reinforces these borrower distinctions.
Conventional borrowers reported median applicant incomes of $128,000, reflecting their stronger credit profiles and lower leverage requirements.
FHA borrowers, with median incomes of $93,000, represent households that benefit from the program's lower down payment requirements and more flexible credit standards.
VA borrowers, despite higher median incomes of $109,000, have the option to use maximum leverage financing as a benefit of military service. Finally, USDA borrowers at $73,000 median income access homeownership in rural markets through the USDA loan programs.
This median income segmentation illustrates why FHA remains strategically important beyond its market share percentage. The program serves a distinct demographic with specific financing needs such as households earning solidly middle-class incomes who require maximum leverage to achieve homeownership.
These borrowers typically demonstrate capacity for higher payment-to-income ratios and represent an underserved segment that benefits from specialized underwriting capabilities and service models designed for their financial profile.
FHA's market share evolution provides valuable perspective for understanding current conditions. From just 4% market share in 2005, FHA expanded to a crisis-era peak of 36.6% in 2009 before settling at today's mid-teens level. This trajectory demonstrates FHA's role as a counter-cyclical stabilizer: market share expands when private capital becomes more restrictive and contracts when credit conditions normalize.
.jpg)
Monitoring shifts in FHA market share, even subtle ones, can serve as an early-warning system for emerging stress or opportunity in housing markets. The program's sensitivity to broader economic conditions makes it a useful barometer for lenders and policymakers alike.
For builders who understand FHA rate incentive strategies, the approach can capture incremental demand without requiring substantial price reductions on homes. Independent lenders face decisions about whether to compete primarily on price, develop niche specializations, or pursue strategic partnerships that provide competitive advantages.
Credit unions can position FHA lending as both a growth mechanism and a community impact initiative, differentiating their approach from more commoditized bank offerings. The combination of member-focused service and pricing flexibility creates natural advantages in affordability-focused market segments.
Regulators and investors benefit from monitoring state-level FHA penetration rates and builder-lender joint-venture activity, as these metrics often provide early signals about developing affordability challenges or emerging competitive dynamics.
Our analysis does not advocate for any particular loan product strategy, as product mix decisions depend on institutional capacity, lending model, and geographic focus of operations and sales teams.
FHA market data serves as a strategic intelligence source that reveals where affordability pressure is building, competitive intensity is increasing, and where future customers are making their initial real estate decisions. This intelligence value exists regardless of whether an institution actively originates FHA loans.
The data patterns we've examined, the geographic rate variations, borrower income distributions, and competitive dynamics, provide insights that inform broader market strategies. A conventional-only lender can use FHA penetration rates to identify markets with affordability stress. A jumbo specialist can track FHA volumes to anticipate where borrowers might transition to higher-priced products. Credit unions can analyze FHA market share to understand community demographics and lending opportunities.
Understanding these market dynamics helps all lenders anticipate shifts, develop competitive positioning, and identify growth opportunities before they become widely apparent. Institutions that integrate FHA market intelligence into their strategic planning processes gain a clearer view of market conditions that affect all borrower segments and loan products.
FHA data functions as an early warning system for broader housing market trends. When FHA market share increases in a region, it often signals affordability challenges that will eventually impact conventional lending. When builder-lenders dominate FHA originations, it reveals competitive strategies that may expand to other loan products. When credit unions gain FHA market share, it indicates community-focused approaches that other lenders might adopt.
Interactive market intelligence represents a fundamental shift from surface-level analysis to comprehensive, loan-level insights. Polygon Vision enables county-level analysis of market dynamics across all loan types, while Polygon Pulse delivers current intelligence on origination patterns and competitive positioning. In a world where large language models are democratizing artificial intelligence, we're democratizing access to market intelligence.
Data-driven insights built on loan-level analysis provide the critical capability that lenders and sales teams need for innovation and growth. Your messaging to prospects, market positioning, and targeting strategies all require robust data foundations to succeed in today's competitive environment.
Ready to explore interactive market analysis? Start with Polygon Vision for comprehensive market intelligence, or jump into current trends with Polygon Pulse.
Discover 2025 FHA interest-rate trends and how builders & lenders leverage them - strategic insights powered by Polygon Vision and Polygon Pulse.
FHA loans anchor the affordable lending ecosystem with a steady 17.4% of first-lien originations in 2024. While this footprint may appear modest, FHA activity serves as a remarkably sensitive gauge of affordability stress, borrower demographics, and competitive behavior throughout the housing finance industry. Our analysis of 2025 year-to-date data through May reveals geographic, institutional, and historical patterns that can inform strategic decision-making.
FHA interest rates vary meaningfully across states, ranging from below 6% in Texas to the mid-6% range in states like Ohio and Illinois. Texas stands out with 42,304 FHA endorsements in the first five months of 2025 and an average rate of 5.9%. This lower average rate reflects a systematic approach where large production builders routinely embed rate buy-downs in sales contracts and channel those loans through builder-affiliated lenders. This practice accelerates new-home sales while establishing local pricing benchmarks that influence broader market competition.
Interest rates exclude fees, points or lender credits.
Without filtering for loan purpose, the average interest rate of an FHA loan was 6.23% 2025YTD through May as we see in our analysis from FHA Pivot, compared to 6.69% across for conventional loans sold to Fannie Mae and Freddie Mac (MBS Pivot). Applying a loan purpose filter for purchase loans, the average interest rate for FHA purchase loan was 6.20% vs. 6.67% for a conventional purchase loan sold to the two GSEs.
The 2025 first-time buyer data provides useful context for strategic planning. Through June, the average first-time buyer using FHA borrowed approximately $321,000 at 6.23%, carried a 691 credit score, had a 45% debt-to-income ratio, and financed 97% of the purchase price. By comparison, conventional first-time buyers borrowed $385,000 at 6.66% with a 755 credit score, 37% debt-to-income ratio, and 83% loan-to-value ratio. We derive these metrics from our MBS Pivot (part of Polygon Pulse bundle of tools), which interactively analyzes agency origination dynamics across loan types and market segments.
The income distribution data from our 2024 HMDA analysis in Polygon Vision reinforces these borrower distinctions.
Conventional borrowers reported median applicant incomes of $128,000, reflecting their stronger credit profiles and lower leverage requirements.
FHA borrowers, with median incomes of $93,000, represent households that benefit from the program's lower down payment requirements and more flexible credit standards.
VA borrowers, despite higher median incomes of $109,000, have the option to use maximum leverage financing as a benefit of military service. Finally, USDA borrowers at $73,000 median income access homeownership in rural markets through the USDA loan programs.
This median income segmentation illustrates why FHA remains strategically important beyond its market share percentage. The program serves a distinct demographic with specific financing needs such as households earning solidly middle-class incomes who require maximum leverage to achieve homeownership.
These borrowers typically demonstrate capacity for higher payment-to-income ratios and represent an underserved segment that benefits from specialized underwriting capabilities and service models designed for their financial profile.
FHA's market share evolution provides valuable perspective for understanding current conditions. From just 4% market share in 2005, FHA expanded to a crisis-era peak of 36.6% in 2009 before settling at today's mid-teens level. This trajectory demonstrates FHA's role as a counter-cyclical stabilizer: market share expands when private capital becomes more restrictive and contracts when credit conditions normalize.
Monitoring shifts in FHA market share, even subtle ones, can serve as an early-warning system for emerging stress or opportunity in housing markets. The program's sensitivity to broader economic conditions makes it a useful barometer for lenders and policymakers alike.
For builders who understand FHA rate incentive strategies, the approach can capture incremental demand without requiring substantial price reductions on homes. Independent lenders face decisions about whether to compete primarily on price, develop niche specializations, or pursue strategic partnerships that provide competitive advantages.
Credit unions can position FHA lending as both a growth mechanism and a community impact initiative, differentiating their approach from more commoditized bank offerings. The combination of member-focused service and pricing flexibility creates natural advantages in affordability-focused market segments.
Regulators and investors benefit from monitoring state-level FHA penetration rates and builder-lender joint-venture activity, as these metrics often provide early signals about developing affordability challenges or emerging competitive dynamics.
Our analysis does not advocate for any particular loan product strategy, as product mix decisions depend on institutional capacity, lending model, and geographic focus of operations and sales teams.
FHA market data serves as a strategic intelligence source that reveals where affordability pressure is building, competitive intensity is increasing, and where future customers are making their initial real estate decisions. This intelligence value exists regardless of whether an institution actively originates FHA loans.
The data patterns we've examined, the geographic rate variations, borrower income distributions, and competitive dynamics, provide insights that inform broader market strategies. A conventional-only lender can use FHA penetration rates to identify markets with affordability stress. A jumbo specialist can track FHA volumes to anticipate where borrowers might transition to higher-priced products. Credit unions can analyze FHA market share to understand community demographics and lending opportunities.
Understanding these market dynamics helps all lenders anticipate shifts, develop competitive positioning, and identify growth opportunities before they become widely apparent. Institutions that integrate FHA market intelligence into their strategic planning processes gain a clearer view of market conditions that affect all borrower segments and loan products.
FHA data functions as an early warning system for broader housing market trends. When FHA market share increases in a region, it often signals affordability challenges that will eventually impact conventional lending. When builder-lenders dominate FHA originations, it reveals competitive strategies that may expand to other loan products. When credit unions gain FHA market share, it indicates community-focused approaches that other lenders might adopt.
Interactive market intelligence represents a fundamental shift from surface-level analysis to comprehensive, loan-level insights. Polygon Vision enables county-level analysis of market dynamics across all loan types, while Polygon Pulse delivers current intelligence on origination patterns and competitive positioning. In a world where large language models are democratizing artificial intelligence, we're democratizing access to market intelligence.
Data-driven insights built on loan-level analysis provide the critical capability that lenders and sales teams need for innovation and growth. Your messaging to prospects, market positioning, and targeting strategies all require robust data foundations to succeed in today's competitive environment.
Ready to explore interactive market analysis? Start with Polygon Vision for comprehensive market intelligence, or jump into current trends with Polygon Pulse.