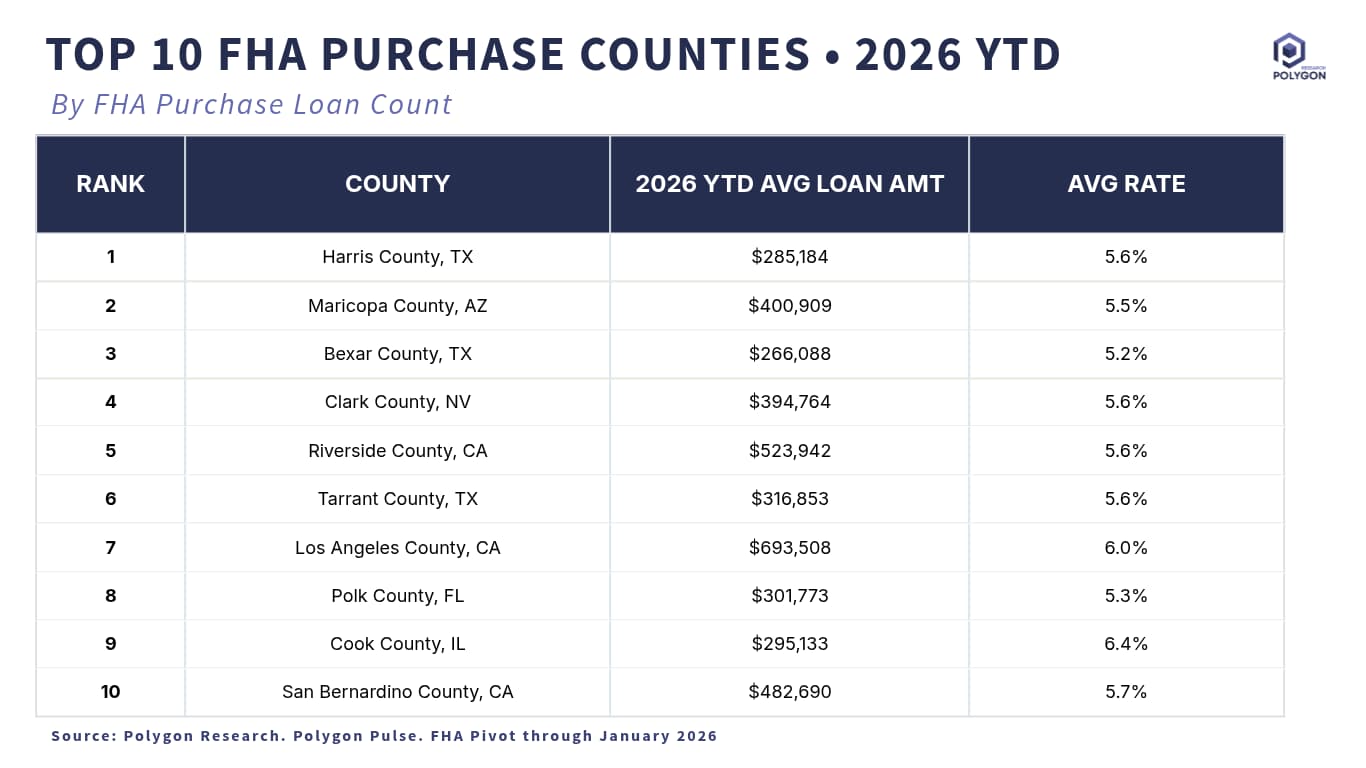
Top FHA Purchase Counties in 2026 YTD: Loan Size and Rate
Data Points
2026 YTD FHA Purchase Rank 1 2 3 4 5 6 7 8 9 10
County Harris County, TX Maricopa County, AZ Bexar County, TX Clark County, NV Riverside County, CA Tarrant County, TX Los Angeles County, CA Polk County, FL Cook County, IL San Bernardino County, CA
2026 YTD Avg Loan Amt $285,184 $400,909 $266,088 $394,764 $523,942 $316,853 $693,508 $301,773 $295,133 $482,690
Avg Rate 5.6% 5.5% 5.2% 5.6% 5.6% 5.6% 6.0% 5.3% 6.4% 5.7%
Which counties are leading FHA purchase originations in 2026 year-to-date?
Date Published:
March 13, 2026
Date Updated:
March 13, 2026
Chart type:
Table
Suggested Citation:
Polygon Research. “Top 10 Counties Ranked by Number of FHA Purchase Originations.” Polygon Pulse - FHA Pivot, 2026 YTD. Data fields: FHA purchase rank, county, average loan amount, average note rate. Scope/filters: FHA purchase originations, top 10 U.S. counties by count, year-to-date 2026. Accessed March 2026.
Key insights
This ranking shows two important FHA realities at once.
- First, demand is concentrated in large-population, fast-growth counties such as Harris, Maricopa, Bexar, Clark, and Tarrant, confirming that FHA remains a core purchase loan in entry-level and payment-sensitive markets.
- Second, the economics of that demand vary materially by geography. Texas counties combine high volume with lower average balances. By contrast, California counties post much higher average loan amounts—especially Los Angeles at nearly $694,000—creating larger per-loan revenue potential for lenders, but also greater payment pressure for borrowers as rates rise.
Cook County stands out with the highest average rate in the group at 6.4%, while Bexar and Polk are among the lowest-rate markets listed. For decision makers, this means FHA strategy should not be based on volume alone. Lenders should align branch growth, LO coverage, and referral strategies to counties where FHA demand is durable.
The practical takeaway: the best FHA markets are where lender capacity, affordability positioning, and county-level borrower profiles are matched deliberately.
From Analysis to Action
This analysis provides a clear blueprint for how to uncover meaningful market dynamics. Its true power is unleashed when you apply this same methodology to your own local markets. Because all real estate is local, this granular approach is essential for crafting precise strategies that effectively address the unique conditions of each community.
Ready to Continue? Get Your Exact Market Answers.
Go beyond generic insights. Polygon's interactive tools and limitless filtering empower you to tailor market data to your specific strategy.
Start your 7-day free trial.
Start your 7-day free trial.