Estimated total Non-QM origination volume, including securitized and portfolio loans.
Total Non-QM origination count across U.S. markets.
Non-QM as a percentage of the total U.S. mortgage origination market.
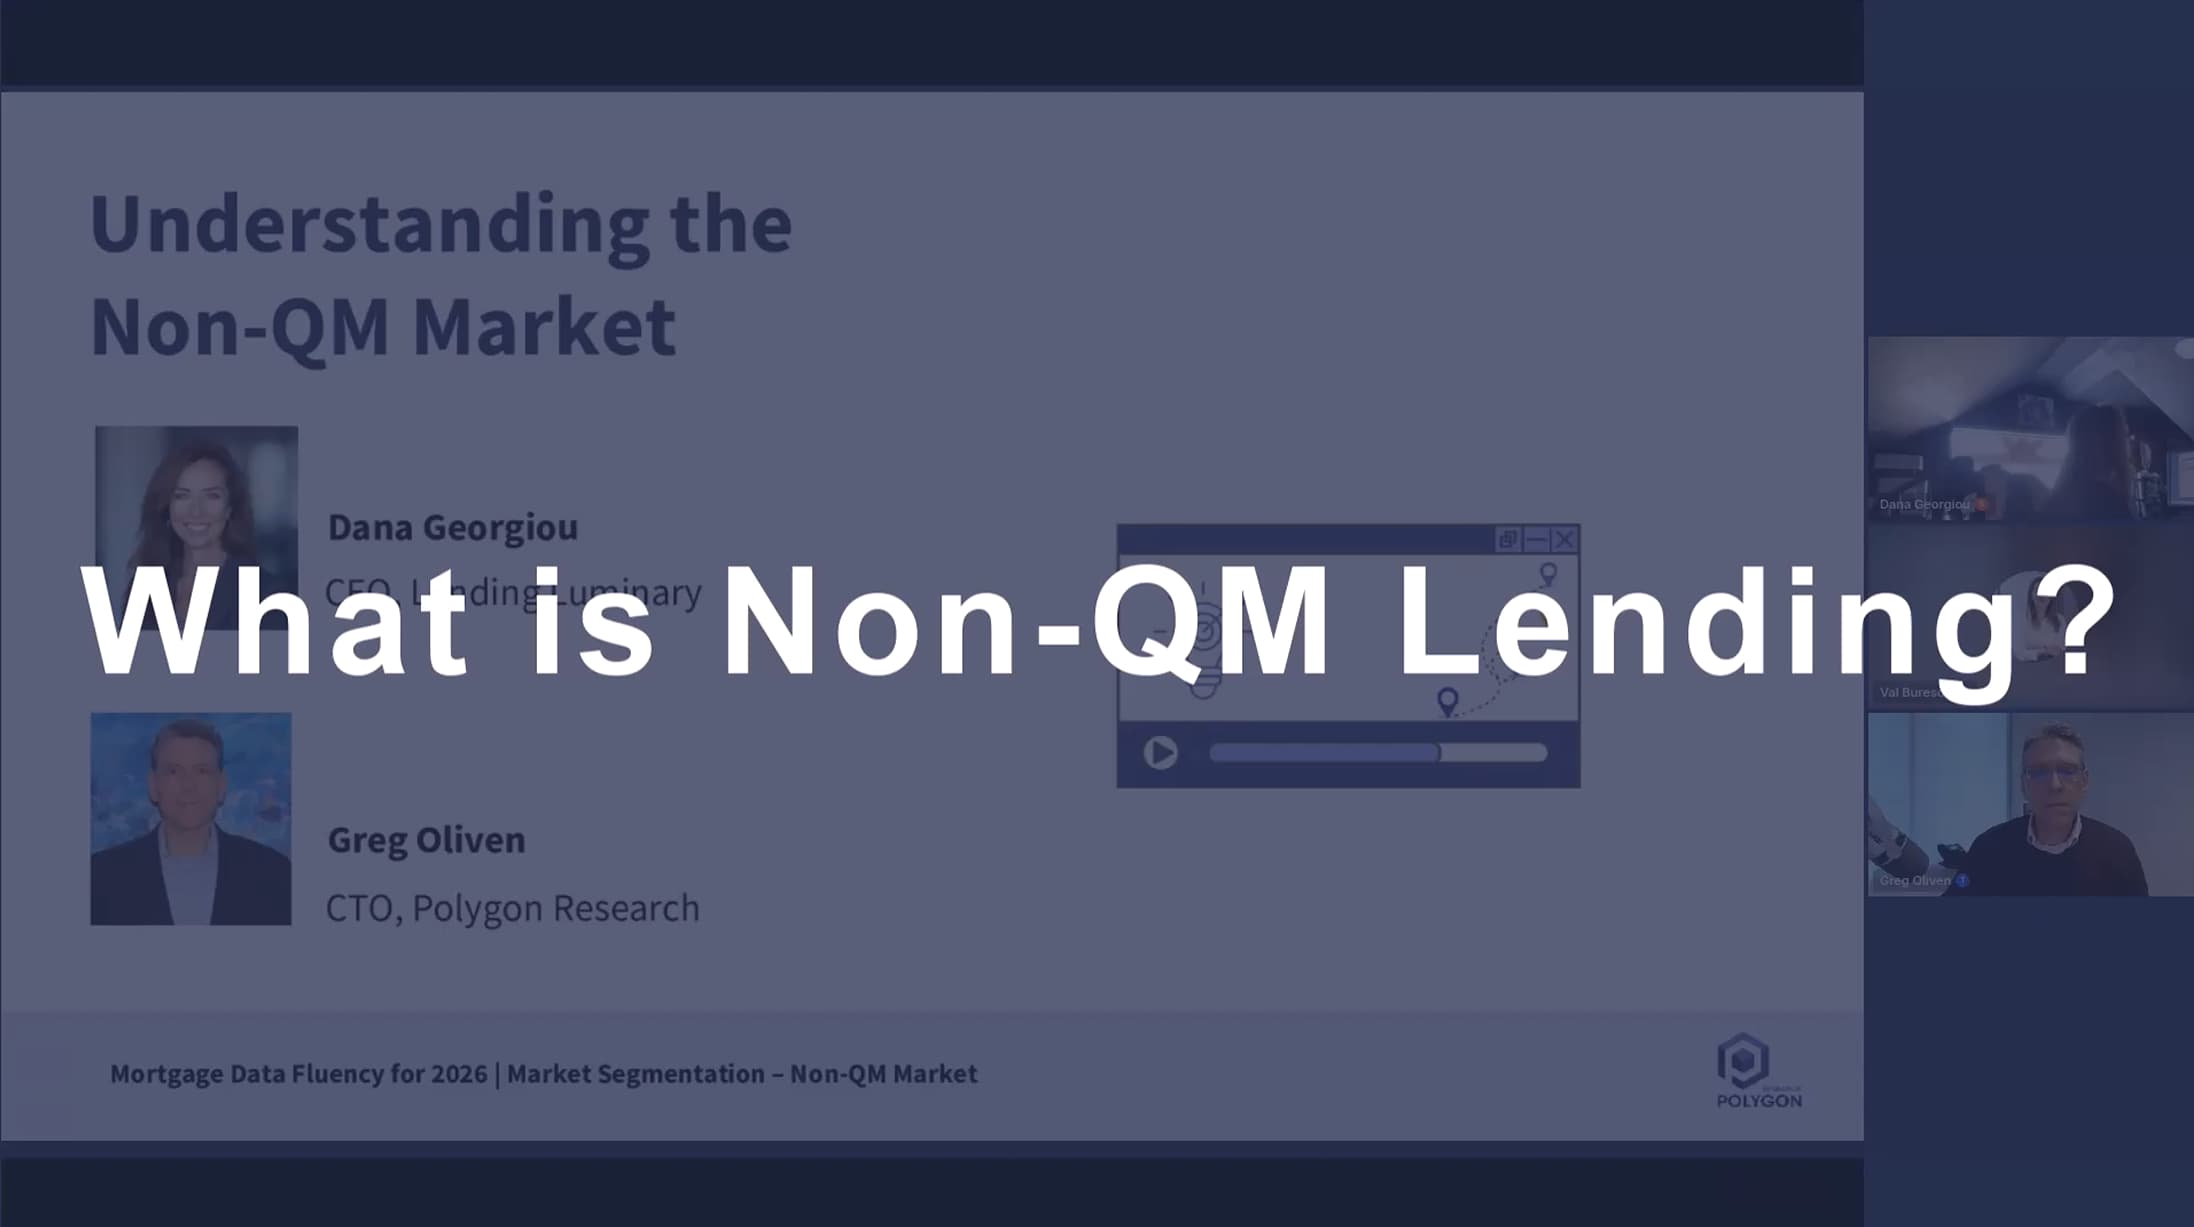
A Non-Qualified Mortgage is any home loan that falls outside the Consumer Financial Protection Bureau's Qualified Mortgage standards. That doesn't mean risky — it means the borrower's income, documentation, or loan structure doesn't fit the conventional box. Bank statement borrowers, DSCR investors, interest-only products, and loans sold to private securitizers all fall into Non-QM.
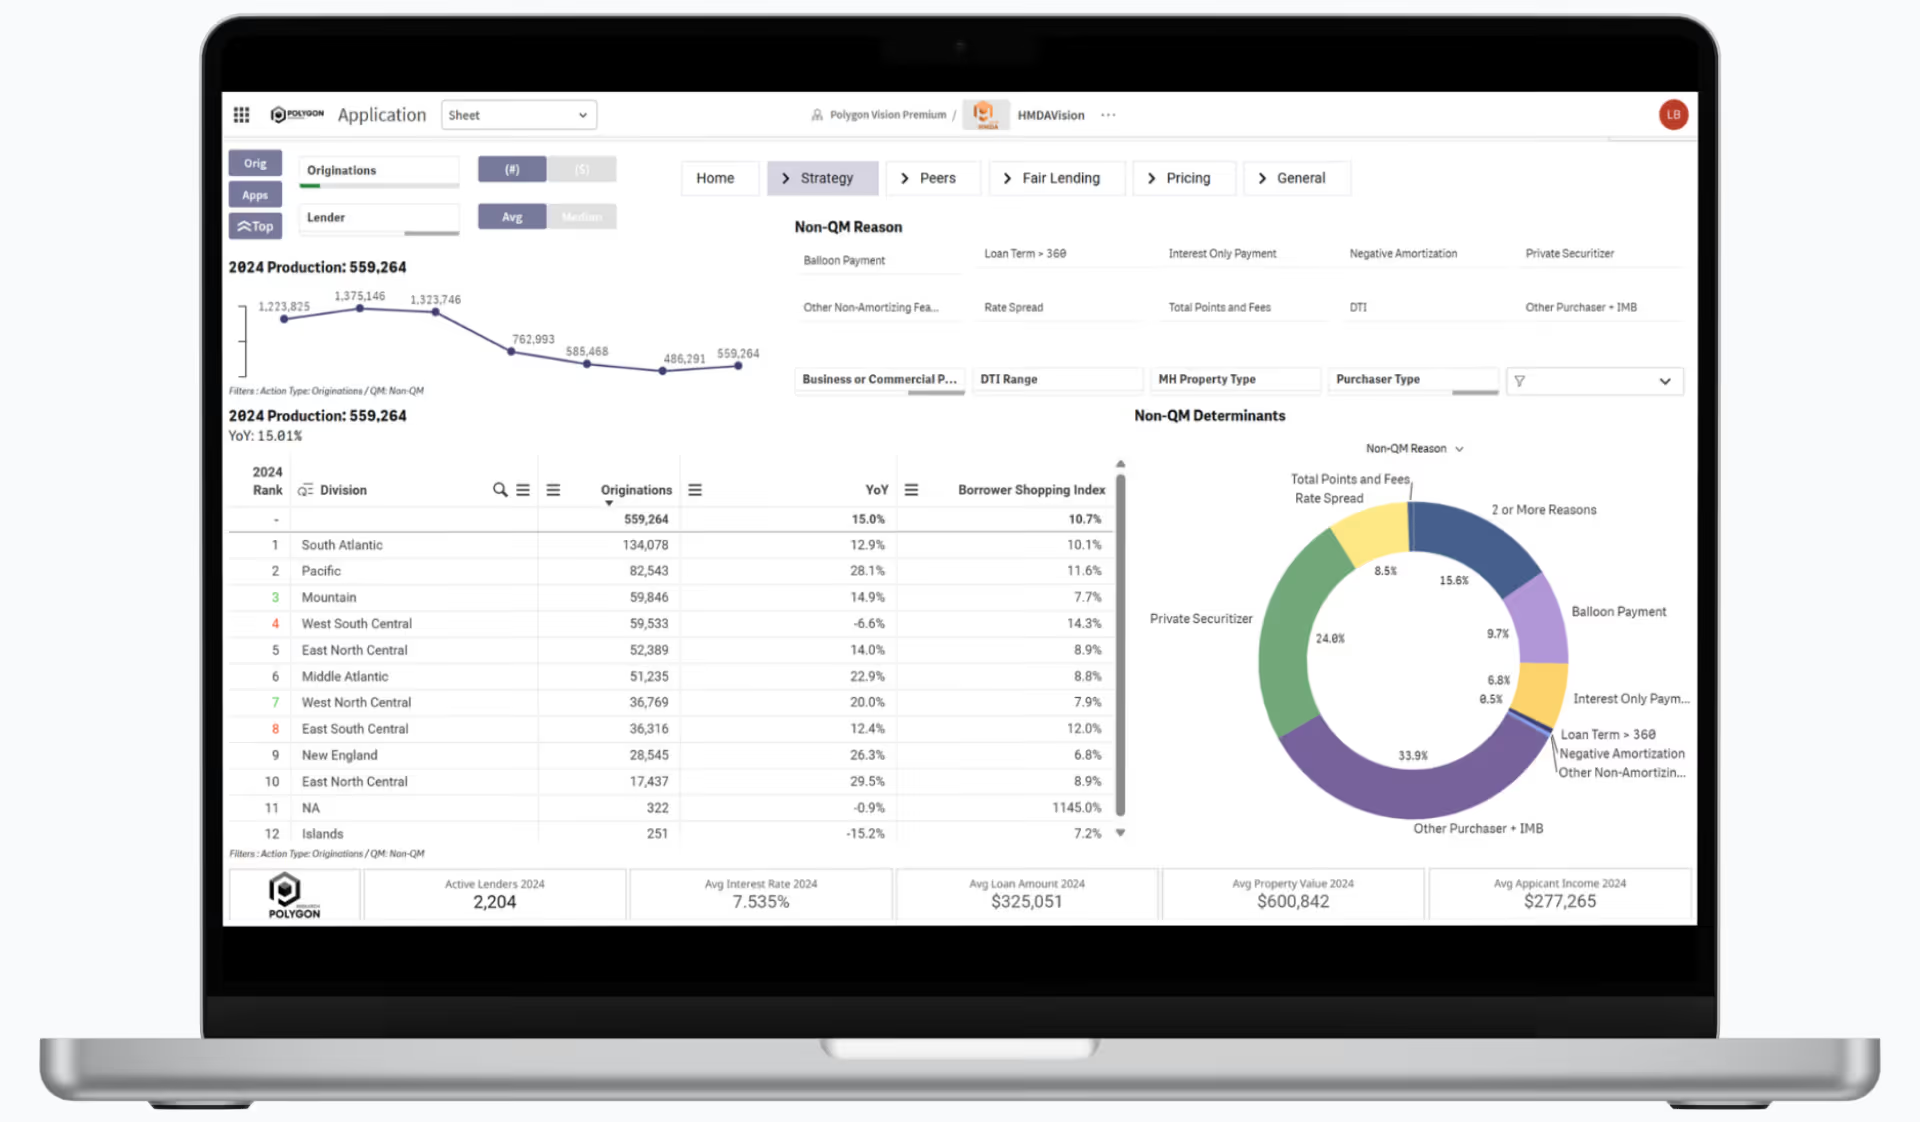
Non-QM is not subprime. It's a growing segment of creditworthy borrowers — self-employed professionals, real estate investors, and high-net-worth individuals — who need financing that conventional guidelines can't accommodate. In 2025, Non-QM reached $239 billion in origination volume across 697,605 loans. Understanding where this volume is concentrated, who's lending it, and how fast it's growing is how you find the opportunity.
Whether you're sizing a new market, building a pitch, or benchmarking your production against the competition — Non-QM market data helps you make the case with numbers, not guesswork.
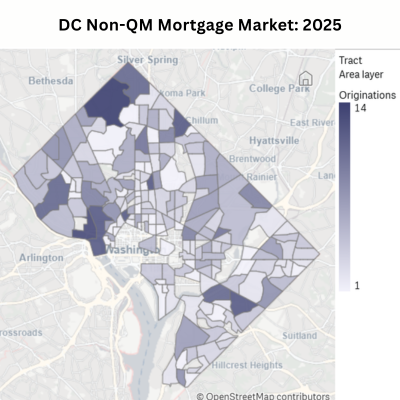
Use it to size the Non-QM opportunity in their footprint and identify which metros or neighborhoods are growing fastest.
See which Non-QM products are moving in your market and where borrower demand is strongest.
Identify high-growth Non-QM markets to recruit brokers and position your products where demand is building.
Analyze Non-QM origination patterns by census tract, income level, and demographics for fair lending review.
Non-QM is difficult to size because public mortgage data does not include a standard Non-QM flag. Polygon Research applies a transparent loan-level methodology to identify Non-QM activity, compare lender market share, analyze product mix, and track local market trends.
Read our guide to see how lenders can move beyond national Non-QM estimates and analyze the market by geography, lender, borrower profile, product feature, and pricing outcome.
Related: See how Polygon Research applies this loan-level methodology in How Big Is the Non-QM Market?
We begin by identifying self-employed households with annual income of $110,000 or more. This threshold is intended to approximate income levels that are more likely to support mortgage borrowing in many markets.
We then exclude households that own their homes free and clear or report paying no rent.
We also estimate the pool of small investors using the total number of single-family rental units in each state. To convert rental units into a likely investor-household count, we apply several simplifying assumptions:


Polygon Vision gives you loan-level Non-QM data for any state, MSA, county, or census tract — including lender rankings, borrower profiles, and borrower-paid pricing. Free for 7 days.
Polygon Research calculates that Non-QM loans represented 10.2% of total U.S. mortgage originations in 2025 by loan count and 10% by dollar volume, totaling over $239 billion across 697,605 loans. This is based on loan-level HMDA data classified using the ATR/QM regulatory framework. This market size analysis is based on Polygon Research's methodology described in a recent whitepaper. You can download it here to learn more: https://www.polygonresearch.com/whitepapers/unlocking-non-qm-market-intelligence
Non-QM analysis is part of Polygon Vision. The Professional plan is $199 per month, or $1,992 per year, which works out to $166 per month with two months free. Executive and Enterprise plans are set up personally by our team. You can also explore the same governed data free on mortgagedata.ai, which has a forever-free tier with no credit card required, plus a $79 per month Essentials plan. Full details at https://www.polygonresearch.com/pricing
Non-QM loans include mortgages that do not meet Qualified Mortgage standards due to factors such as alternative income documentation (bank statement loans), debt service coverage ratio underwriting (DSCR loans for investors), interest-only payment structures, pricing above QM thresholds, or sale to private securitizers rather than government-sponsored enterprises. For analytical purposes, Polygon Research also flags business-purpose and DSCR loans separately within the Non-QM category. Download the full methodology: https://www.polygonresearch.com/whitepapers/unlocking-non-qm-market-intelligence
Start free on mortgagedata.ai, which has a forever-free tier — 3 answers a day and 15 a month, with no credit card required. For the full Polygon Vision suite, ask us for a guided 7-day trial and our team will set you up personally. See all plans at https://www.polygonresearch.com/pricing
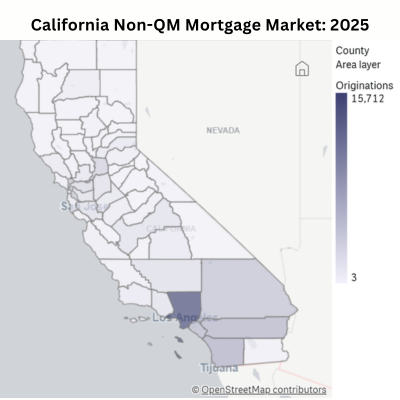
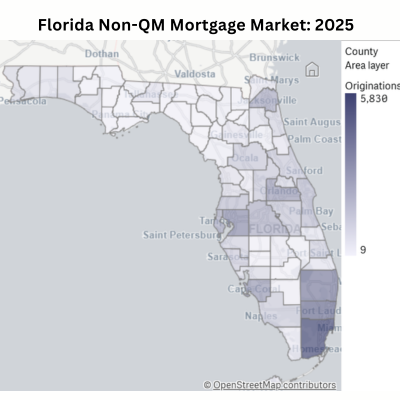
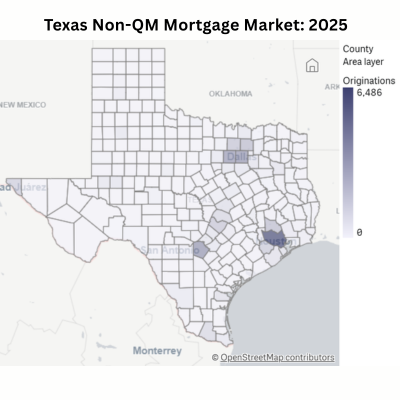
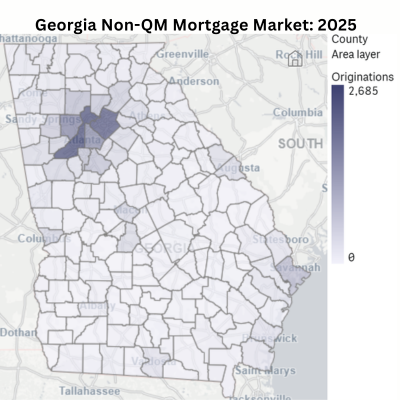
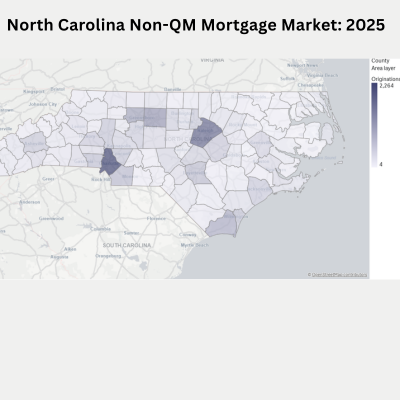
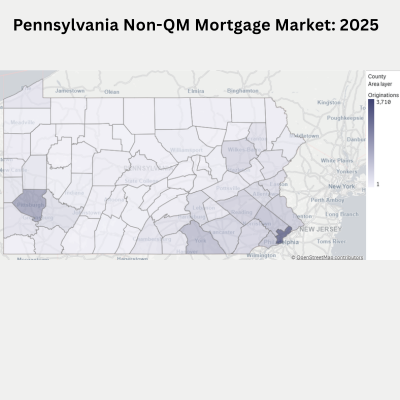
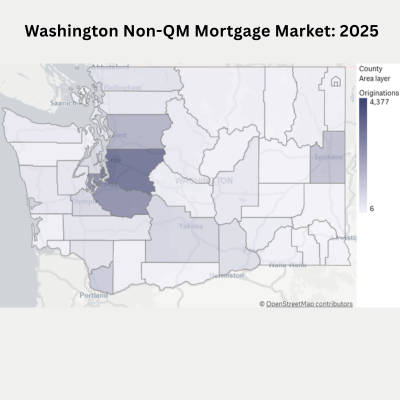
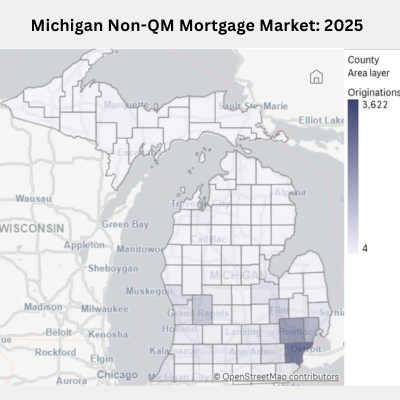
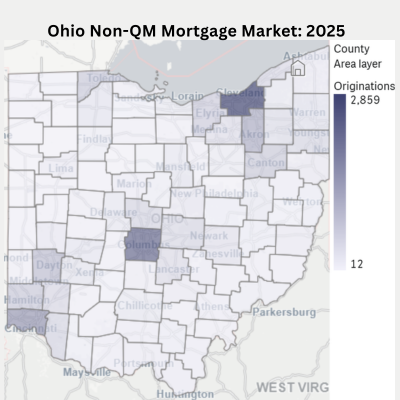
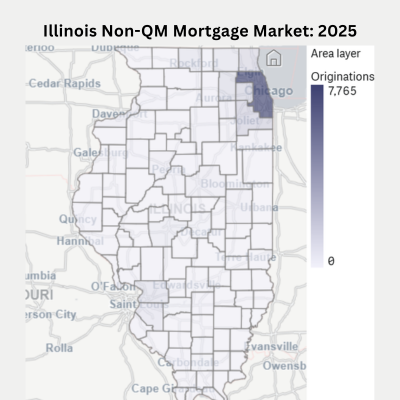
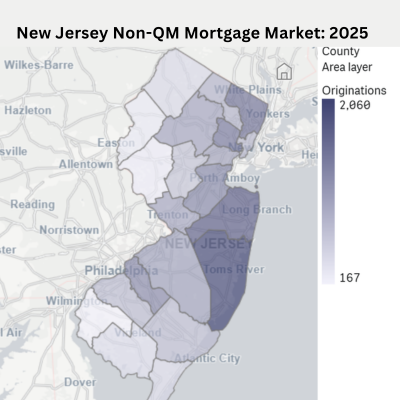
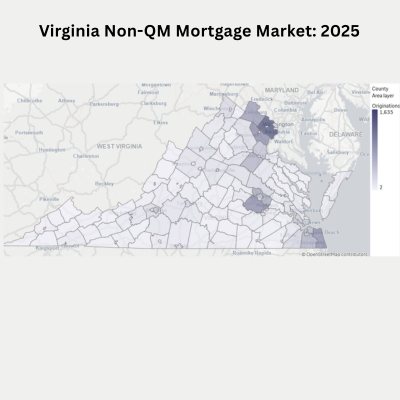
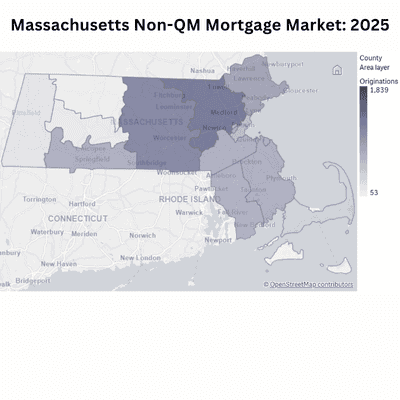
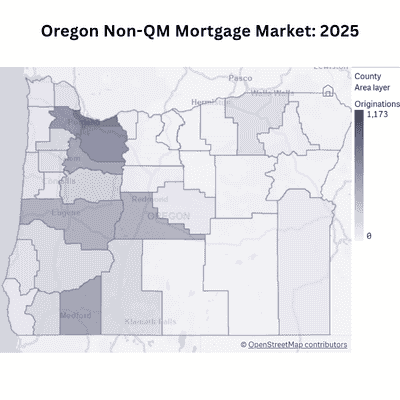
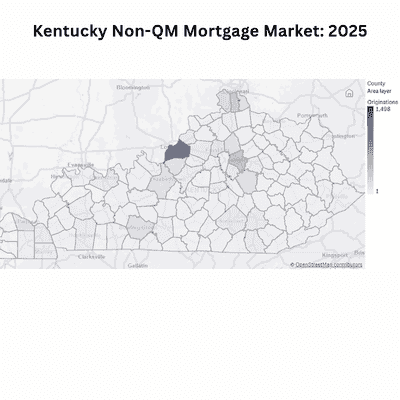
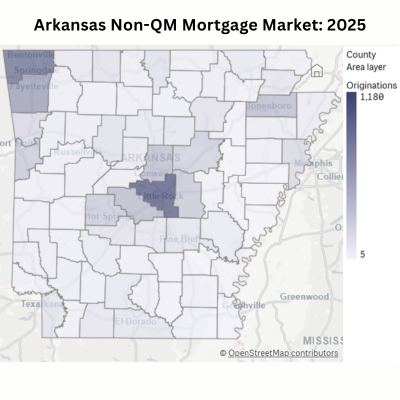
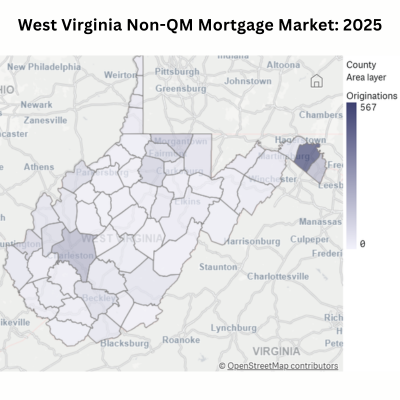
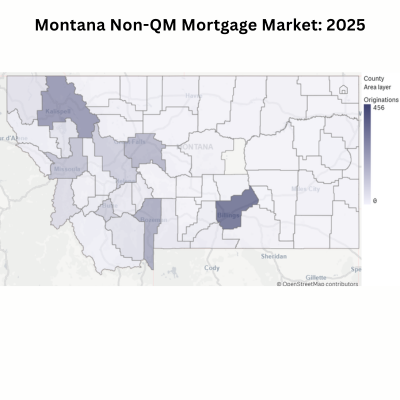
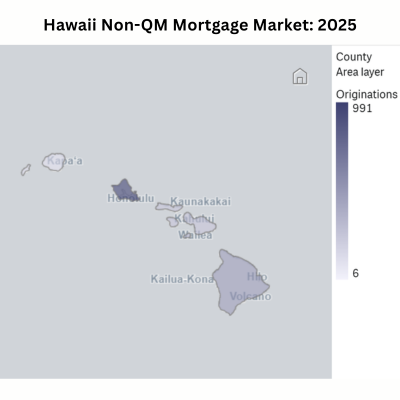
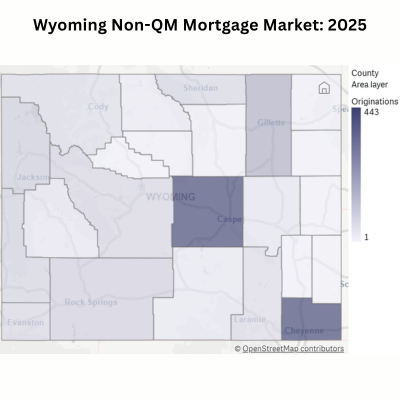
Yes. Polygon Vision provides loan-level Non-QM analysis filterable by state, metropolitan area, county, and census tract. Data includes origination volume, top lenders, borrower profiles, pricing, and year-over-year growth trends. Free state-level reports are available on this page, and you can explore the underlying data free on mortgagedata.ai, which has a forever-free tier with no credit card required.
Each HMDA loan record from 2018 through 2025 is evaluated against year-specific Ability-to-Repay and Qualified Mortgage standards from 12 CFR §1026.43. Classification is based on observable loan characteristics including pricing thresholds, product features, fee structures, and purchaser type. The full methodology is publicly documented: https://www.polygonresearch.com/whitepapers/unlocking-non-qm-market-intelligence
Most industry estimates rely on securitization data, inferred flags from known Non-QM lender names, samples, or lock activity. Polygon analyzes all funded HMDA loans, including portfolio lending, providing a more complete and transparent view of the Non-QM market. Read our methodology: https://www.polygonresearch.com/whitepapers/unlocking-non-qm-market-intelligence
Yes. For analytical purposes, business-purpose and DSCR loans are incorporated into the Non-QM category and flagged separately, even though ATR/QM rules do not govern business-purpose credit. Learn more in our methodology whitepaper.
Yes. Polygon's Non-QM classification is fully transparent and built on specific, loan-level reason codes (pricing, fees, product features, purchaser type, and more). Users can filter and adjust these factors to focus only on regulatory features or build a custom definition aligned with their strategy, risk, or compliance needs. Download the methodology to learn more: https://www.polygonresearch.com/whitepapers/unlocking-non-qm-market-intelligence
No. Polygon Research's Non-QM designation is a Regulation Z informed analytic classification designed for market intelligence, benchmarking, and strategy. It is not a substitute for lender-side legal or compliance determinations. To learn more, download the methodology: https://www.polygonresearch.com/whitepapers/unlocking-non-qm-market-intelligence