.jpg)
With the 2024 American Community Survey (ACS) 1-Year estimates set to release on September 11, 2025—just two days away—mortgage lenders can prepare for new relocation insights using CensusVision from Polygon Research. This U.S. Census Bureau resource surveys millions of households annually on relocation, income, and demographics, accessed seamlessly through CensusVision, part of the Polygon Vision suite. Paired with HMDAVision, the suite provides a full view: CensusVision uncovers market potential from relocation trends, while HMDAVision shows real lending outcomes like purchase originations.
In the Mountain Division (Arizona, Colorado, Idaho, Montana, New Mexico, Nevada, Utah, Wyoming), for example, CensusVision insights reveal how movers drive growth. These insights should be incorporated in guiding decisions on products, staffing, and compliance year after year, applicable anywhere with similar patterns, whether moves are local or interstate. Use this to expand into new markets and boost revenue.
CensusVision uses the ACS data to track household moves, including in-state and out-of-state, signaling where mortgage demand is rising. In the Mountain Division, about 1.3 million households relocate yearly, blending local shifts (e.g., within Arizona) and inflows (e.g., from California to Nevada). CensusVision helps lenders match resources to these patterns, like allocating marketing budgets to high-move areas for a stronger pipeline. HMDAVision confirms the impact, showing a 3.21% rise in purchase originations to 320,954 units, ($133 Billion in loan volume), linking trends to actual loans and better business planning.
Relocation data shows tenure splits, with renters making up 67% of movers. This is the addressable market, which lenders must understand to target with purchase offers. This lets lenders create targeted campaigns, offering low-down-payment loans to fit their needs. As markets evolve with new ACS releases, CensusVision keeps data current for strategy tweaks. HMDAVision tracks conversions to closed deals, ensuring campaigns lead to fair lending compliance and higher approval rates.
ACS 1-Year PUMS (microdata) in CensusVision breaks down insights to neighborhood-like levels via Public Use Microdata Areas (PUMAs), going beyond states or metros. In the Mountain Division, it highlights hotspots like urban Arizona or Colorado suburbs, aligned with high purchase volumes. Lenders can use this for branch placement or marketing focus, maximizing ROI. HMDAVision maps lending activity, helping spot underserved areas for better fair lending results.
ACS microdata details mover profiles, like age and income, to inform products and staffing.
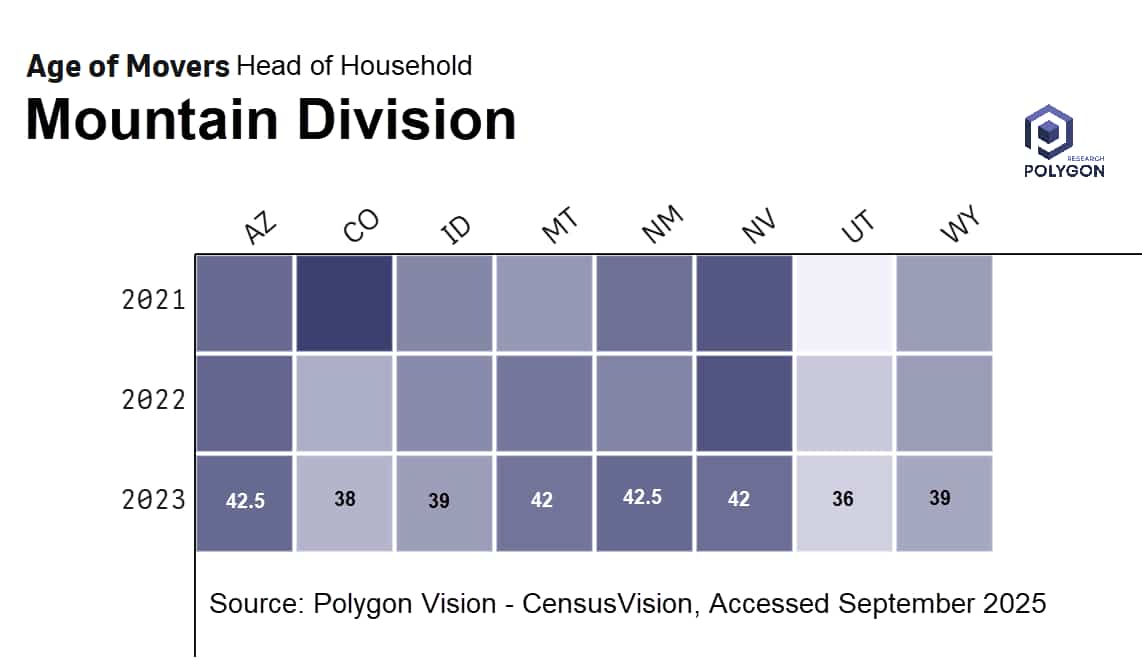
In the Mountain Division, the heat map (from CensusVision) shows trends in average age of households that move. Colorado's movers average 38.0 years (younger), versus Arizona and Nevada at 40-42 years. The overall average age for the Mountain Division movers is 40.2-year average and $92,000 incomes. This guides loan matching - FHA for younger, first-time homebuyer families, conventional for mid-career pros, reverse mortgages for retirees. CensusVision's breakdowns support tailored outreach, while HMDAVision ensures equitable outcomes and origination success.
CensusVision distills ACS insights for cash buyers - 30.6% of Mountain Division movers buy with cash. Lenders can counter this with competitive financing offers. CensusVision identifies trends, HMDAVision validates results, refining strategies for more financed deals and balanced portfolios.
Migration creates new homebuyers, ACS data tracks it, and Polygon Vision transforms that data into insights for loan growth. CensusVision uses ACS data to pinpoint where new homebuyers are, helping you target the right markets and products. HMDAVision tracks your results, showing how many loans you close and how you compete, ensuring fair lending practices. With new ACS data released annually, this suite keeps your strategies sharp.
Start your 7-day free trial of Polygon Vision today.

Grow your lending business with ACS relocation data. Start your 7-day Polygon Vision trial. Prep for the new ACS release.
With the 2024 American Community Survey (ACS) 1-Year estimates set to release on September 11, 2025—just two days away—mortgage lenders can prepare for new relocation insights using CensusVision from Polygon Research. This U.S. Census Bureau resource surveys millions of households annually on relocation, income, and demographics, accessed seamlessly through CensusVision, part of the Polygon Vision suite. Paired with HMDAVision, the suite provides a full view: CensusVision uncovers market potential from relocation trends, while HMDAVision shows real lending outcomes like purchase originations.
In the Mountain Division (Arizona, Colorado, Idaho, Montana, New Mexico, Nevada, Utah, Wyoming), for example, CensusVision insights reveal how movers drive growth. These insights should be incorporated in guiding decisions on products, staffing, and compliance year after year, applicable anywhere with similar patterns, whether moves are local or interstate. Use this to expand into new markets and boost revenue.
CensusVision uses the ACS data to track household moves, including in-state and out-of-state, signaling where mortgage demand is rising. In the Mountain Division, about 1.3 million households relocate yearly, blending local shifts (e.g., within Arizona) and inflows (e.g., from California to Nevada). CensusVision helps lenders match resources to these patterns, like allocating marketing budgets to high-move areas for a stronger pipeline. HMDAVision confirms the impact, showing a 3.21% rise in purchase originations to 320,954 units, ($133 Billion in loan volume), linking trends to actual loans and better business planning.
Relocation data shows tenure splits, with renters making up 67% of movers. This is the addressable market, which lenders must understand to target with purchase offers. This lets lenders create targeted campaigns, offering low-down-payment loans to fit their needs. As markets evolve with new ACS releases, CensusVision keeps data current for strategy tweaks. HMDAVision tracks conversions to closed deals, ensuring campaigns lead to fair lending compliance and higher approval rates.
ACS 1-Year PUMS (microdata) in CensusVision breaks down insights to neighborhood-like levels via Public Use Microdata Areas (PUMAs), going beyond states or metros. In the Mountain Division, it highlights hotspots like urban Arizona or Colorado suburbs, aligned with high purchase volumes. Lenders can use this for branch placement or marketing focus, maximizing ROI. HMDAVision maps lending activity, helping spot underserved areas for better fair lending results.
ACS microdata details mover profiles, like age and income, to inform products and staffing.
In the Mountain Division, the heat map (from CensusVision) shows trends in average age of households that move. Colorado's movers average 38.0 years (younger), versus Arizona and Nevada at 40-42 years. The overall average age for the Mountain Division movers is 40.2-year average and $92,000 incomes. This guides loan matching - FHA for younger, first-time homebuyer families, conventional for mid-career pros, reverse mortgages for retirees. CensusVision's breakdowns support tailored outreach, while HMDAVision ensures equitable outcomes and origination success.
CensusVision distills ACS insights for cash buyers - 30.6% of Mountain Division movers buy with cash. Lenders can counter this with competitive financing offers. CensusVision identifies trends, HMDAVision validates results, refining strategies for more financed deals and balanced portfolios.
Migration creates new homebuyers, ACS data tracks it, and Polygon Vision transforms that data into insights for loan growth. CensusVision uses ACS data to pinpoint where new homebuyers are, helping you target the right markets and products. HMDAVision tracks your results, showing how many loans you close and how you compete, ensuring fair lending practices. With new ACS data released annually, this suite keeps your strategies sharp.
Start your 7-day free trial of Polygon Vision today.