Agency ARM Borrower Credit Profile

Loan Pricing
Four-panel chart showing YTD 2026 Agency ARM borrowers with lower average FICO and higher average LTV, DTI and 97–100% LTV share than in 2021.
Chart Download and Page Share

Share or Download

Data Points
Scope | Agency ARM borrower credit profile | Comparison: 2021 vs. YTD 2026 Average FICO Score | Credit quality | 2021: 766 | YTD 2026: 737 | Chart change: −29 pts Average LTV | Skin in the game | 2021: 64% | YTD 2026: 79% | Chart change: +15 pts Average DTI | Borrower stress | 2021: 32.2% | YTD 2026: 40.4% | Chart change: +8.2 pts Zero-Equity Bucket | 97–100% LTV | 2021: 0.4% | YTD 2026: 15.7% | Chart change: ≈39×
Are Agency ARM borrowers becoming more financially stretched?
Yes. Recent borrowers have lower FICOs and substantially higher leverage.
Date Published:
June 24, 2026
Date Updated:
June 25, 2026
Chart type:
Slope Chart
Suggested Citation:
Polygon Research, “Agency ARM Borrower Credit Profile: 2021 vs. YTD 2026,” MBS Pivot (Polygon Pulse), updated June 2026. Data through May 2026. Scope: Agency adjustable-rate mortgages. Metric: average FICO score, average LTV, average DTI and share of loans with 97–100% LTV. Accessed June 24, 2026.
Key insights

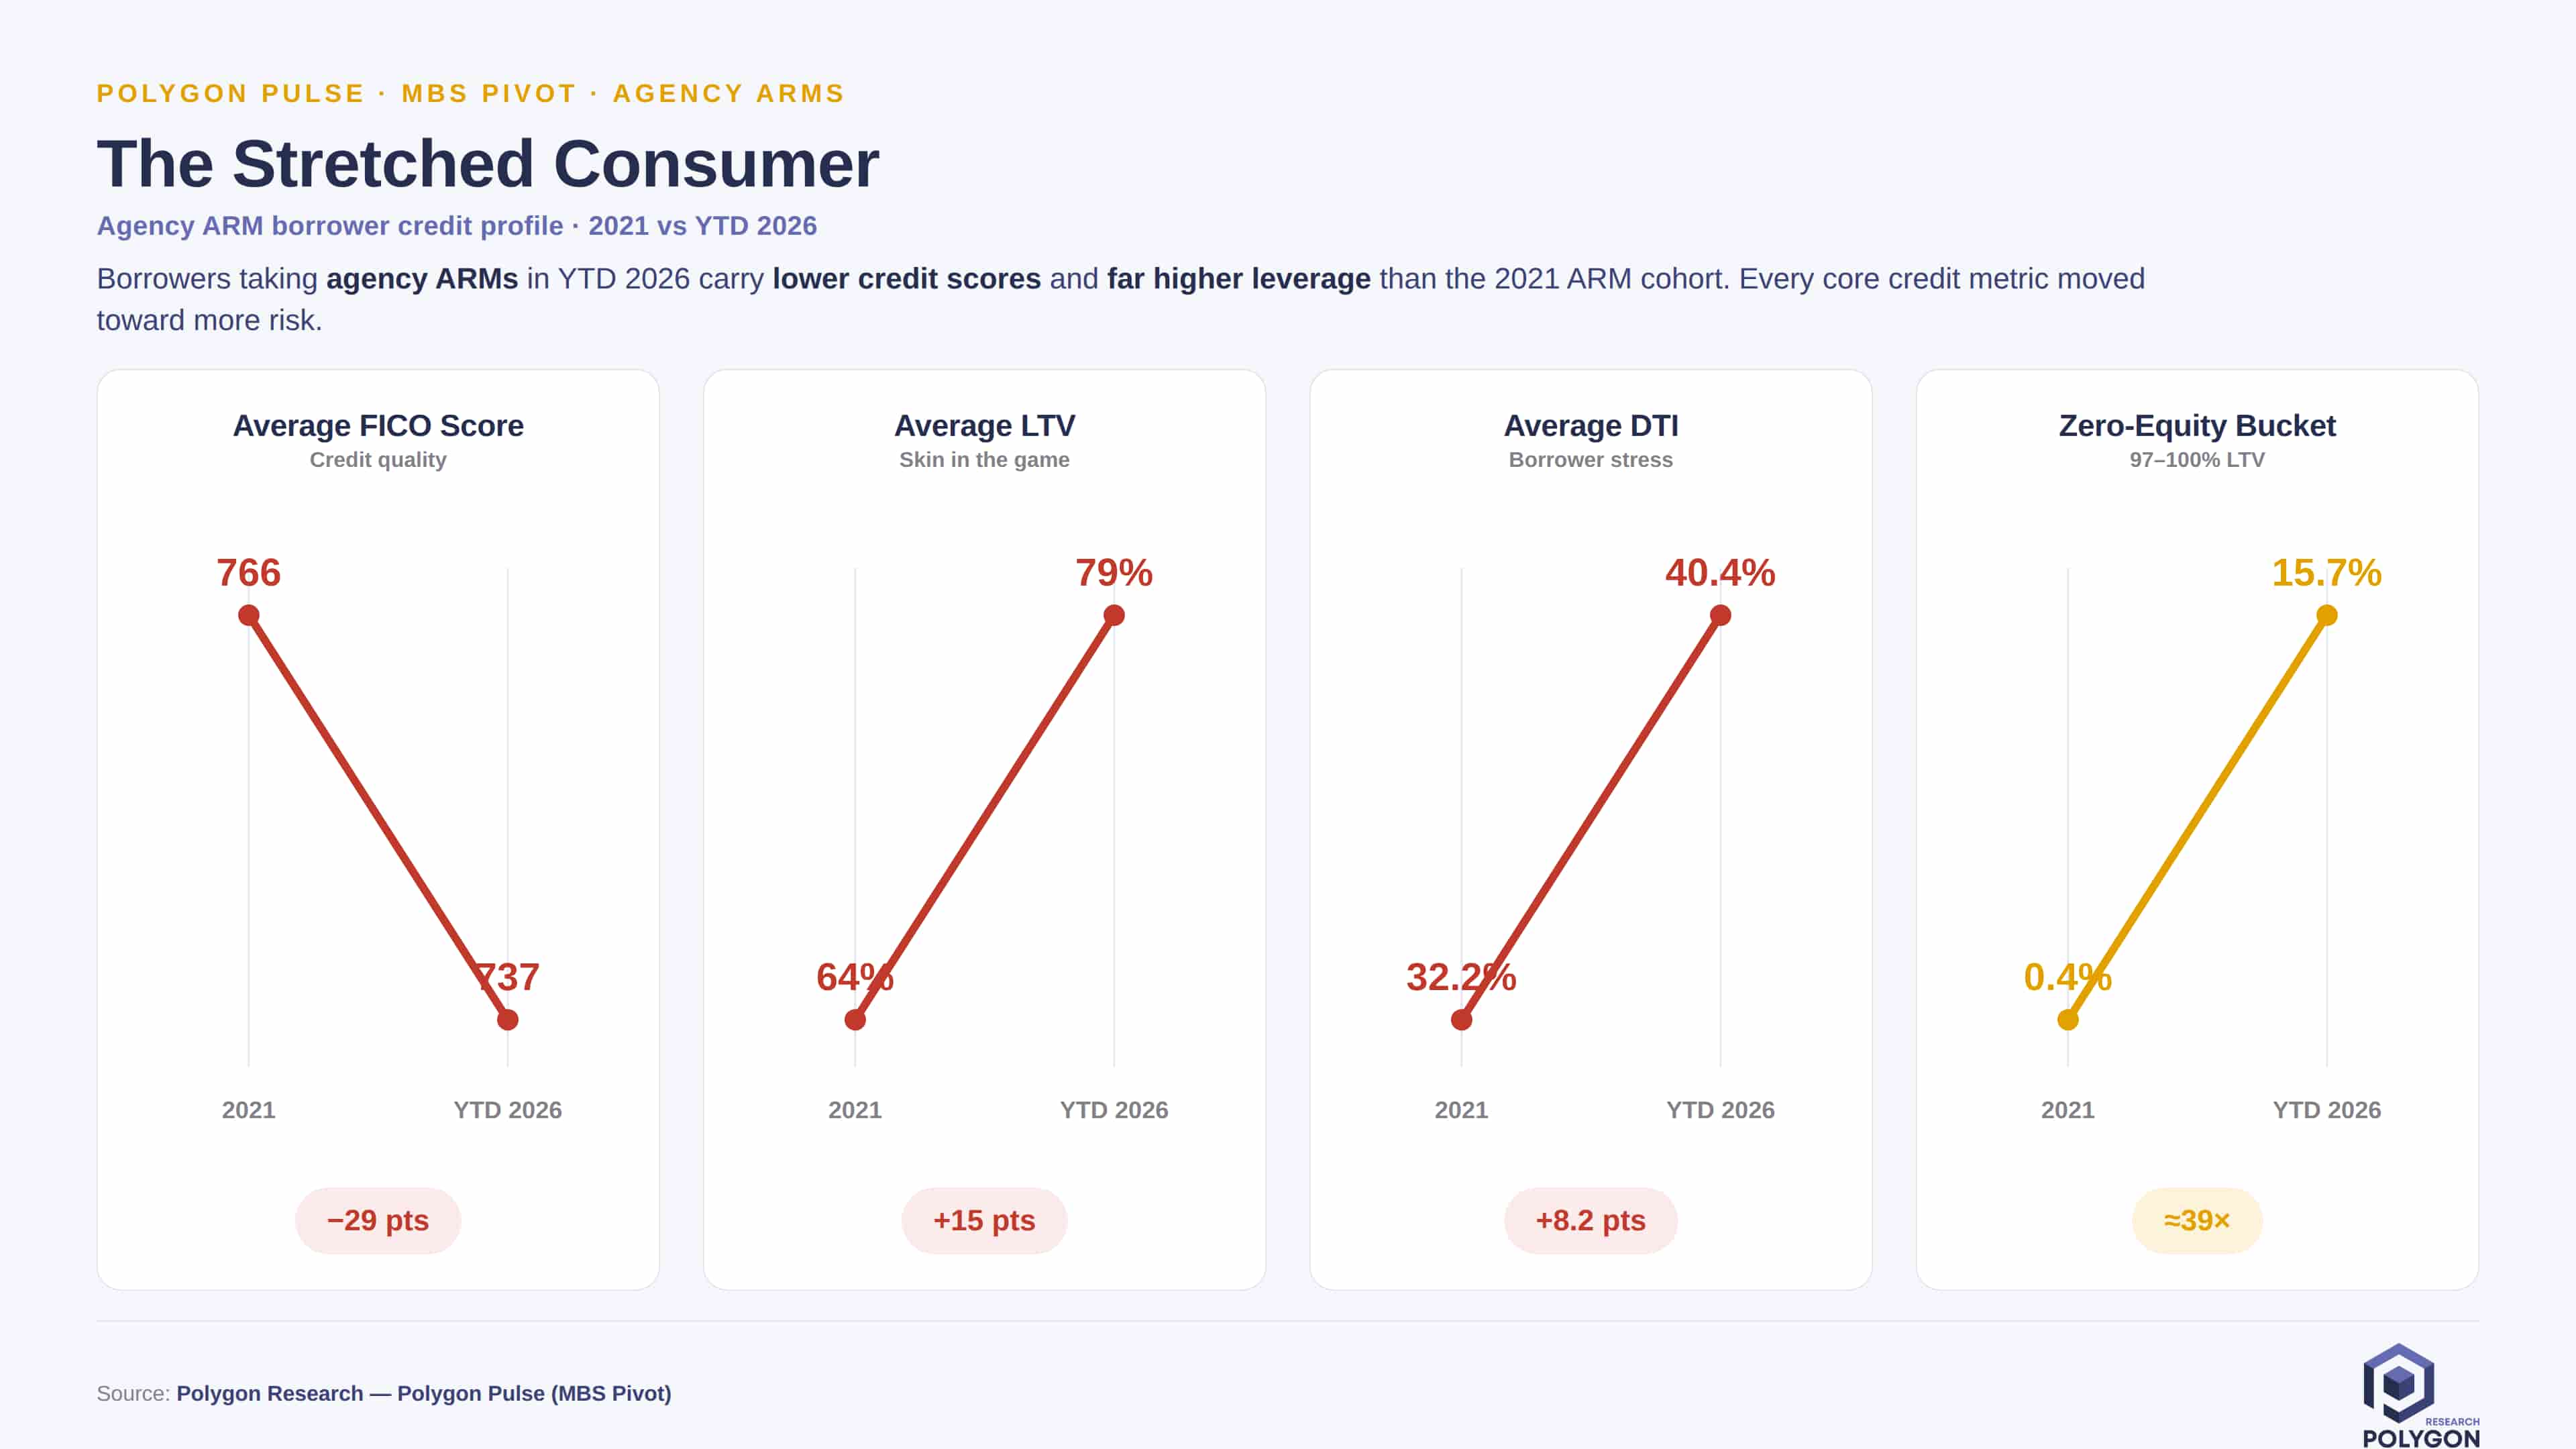
YTD 2026 Agency ARM borrowers have a lower credit score and more highly leveraged credit profile than the 2021 cohort, based on the four measures shown in MBS Pivot.

Average FICO declined from 766 to 737, while average LTV increased from 64% to 79% and average DTI rose from 32.2% to 40.4%. The largest relative change occurred in the chart-defined Zero-Equity Bucket: the share of loans with 97–100% LTV increased from 0.4% to 15.7%, approximately 39 times the 2021 level.

Together, the metrics show a current cohort entering with less borrower equity, greater debt burden relative to income and lower average credit scores.

For broader context on product strategy, pricing and borrower demand, see What Does the ARM Comeback Mean for Mortgage Lenders in 2025?

Lenders can use the comparison to review eligibility, pricing, mortgage-insurance exposure and layered-risk concentrations by credit band. Capital-markets and servicing teams can segment the cohort when evaluating execution, retention and performance assumptions. These descriptive averages do not establish causation or predict future loan performance. Because the chart compares full-year 2021 with YTD 2026, the results are best viewed as a directional measure of how the Agency ARM borrower mix has shifted over time.

From Analysis to Action

This analysis provides a clear blueprint for how to uncover meaningful market dynamics. Its true power is unleashed when you apply this same methodology to your own local markets. Because all real estate is local, this granular approach is essential for crafting precise strategies that effectively address the unique conditions of each community.

Ready to Continue? Get Your Exact Market Answers.

Go beyond generic insights. Polygon's interactive tools and limitless filtering empower you to tailor market data to your specific strategy.
Start your 7-day free trial.
Unlock My Custom Insights Now - Free Trial