Agency Adjustable-Rate Mortgage Market Share

Origination Trends
Agency ARM share rose from 0.31% in 2021 to 3.34% in 2026 YTD, a roughly tenfold increase by loan count.
Chart Download and Page Share

Share or Download

Data Points
ARM MARKET SHARE | Increase, 2021 to YTD 2026 | 10× ARM market share | 2021 | 0.31% ARM market share | YTD 2026 | 3.34% TOTAL MARKET LOANS | 2021 · full year | 11.6M TOTAL MARKET LOANS | 2026 · YTD | 1.17M TOTAL ARM LOANS | 2021 · full year | 35,591 TOTAL ARM LOANS | 2026 · YTD | 39,166 Comparability note | Market share compares directly across periods. Absolute loan counts reflect different spans—full-year 2021 versus year-to-date 2026—and are shown as levels, not growth. Source | Polygon Research — Polygon Pulse (MBS Pivot)
What percentage of mortgages are adjustable-rate?
Agency ARMs are 3.34% of reported originations in 2026 YTD through May.
Date Published:
June 24, 2026
Date Updated:
June 25, 2026
Chart type:
KPI
Suggested Citation:
Polygon Research, “Agency ARM Loan-Count Share of Reported Originations: 2021 vs. 2026 YTD,” Polygon Pulse – MBS Pivot. Data through May 2026. Scope: agency mortgage originations; national level. Accessed June 24, 2026.
Key insights

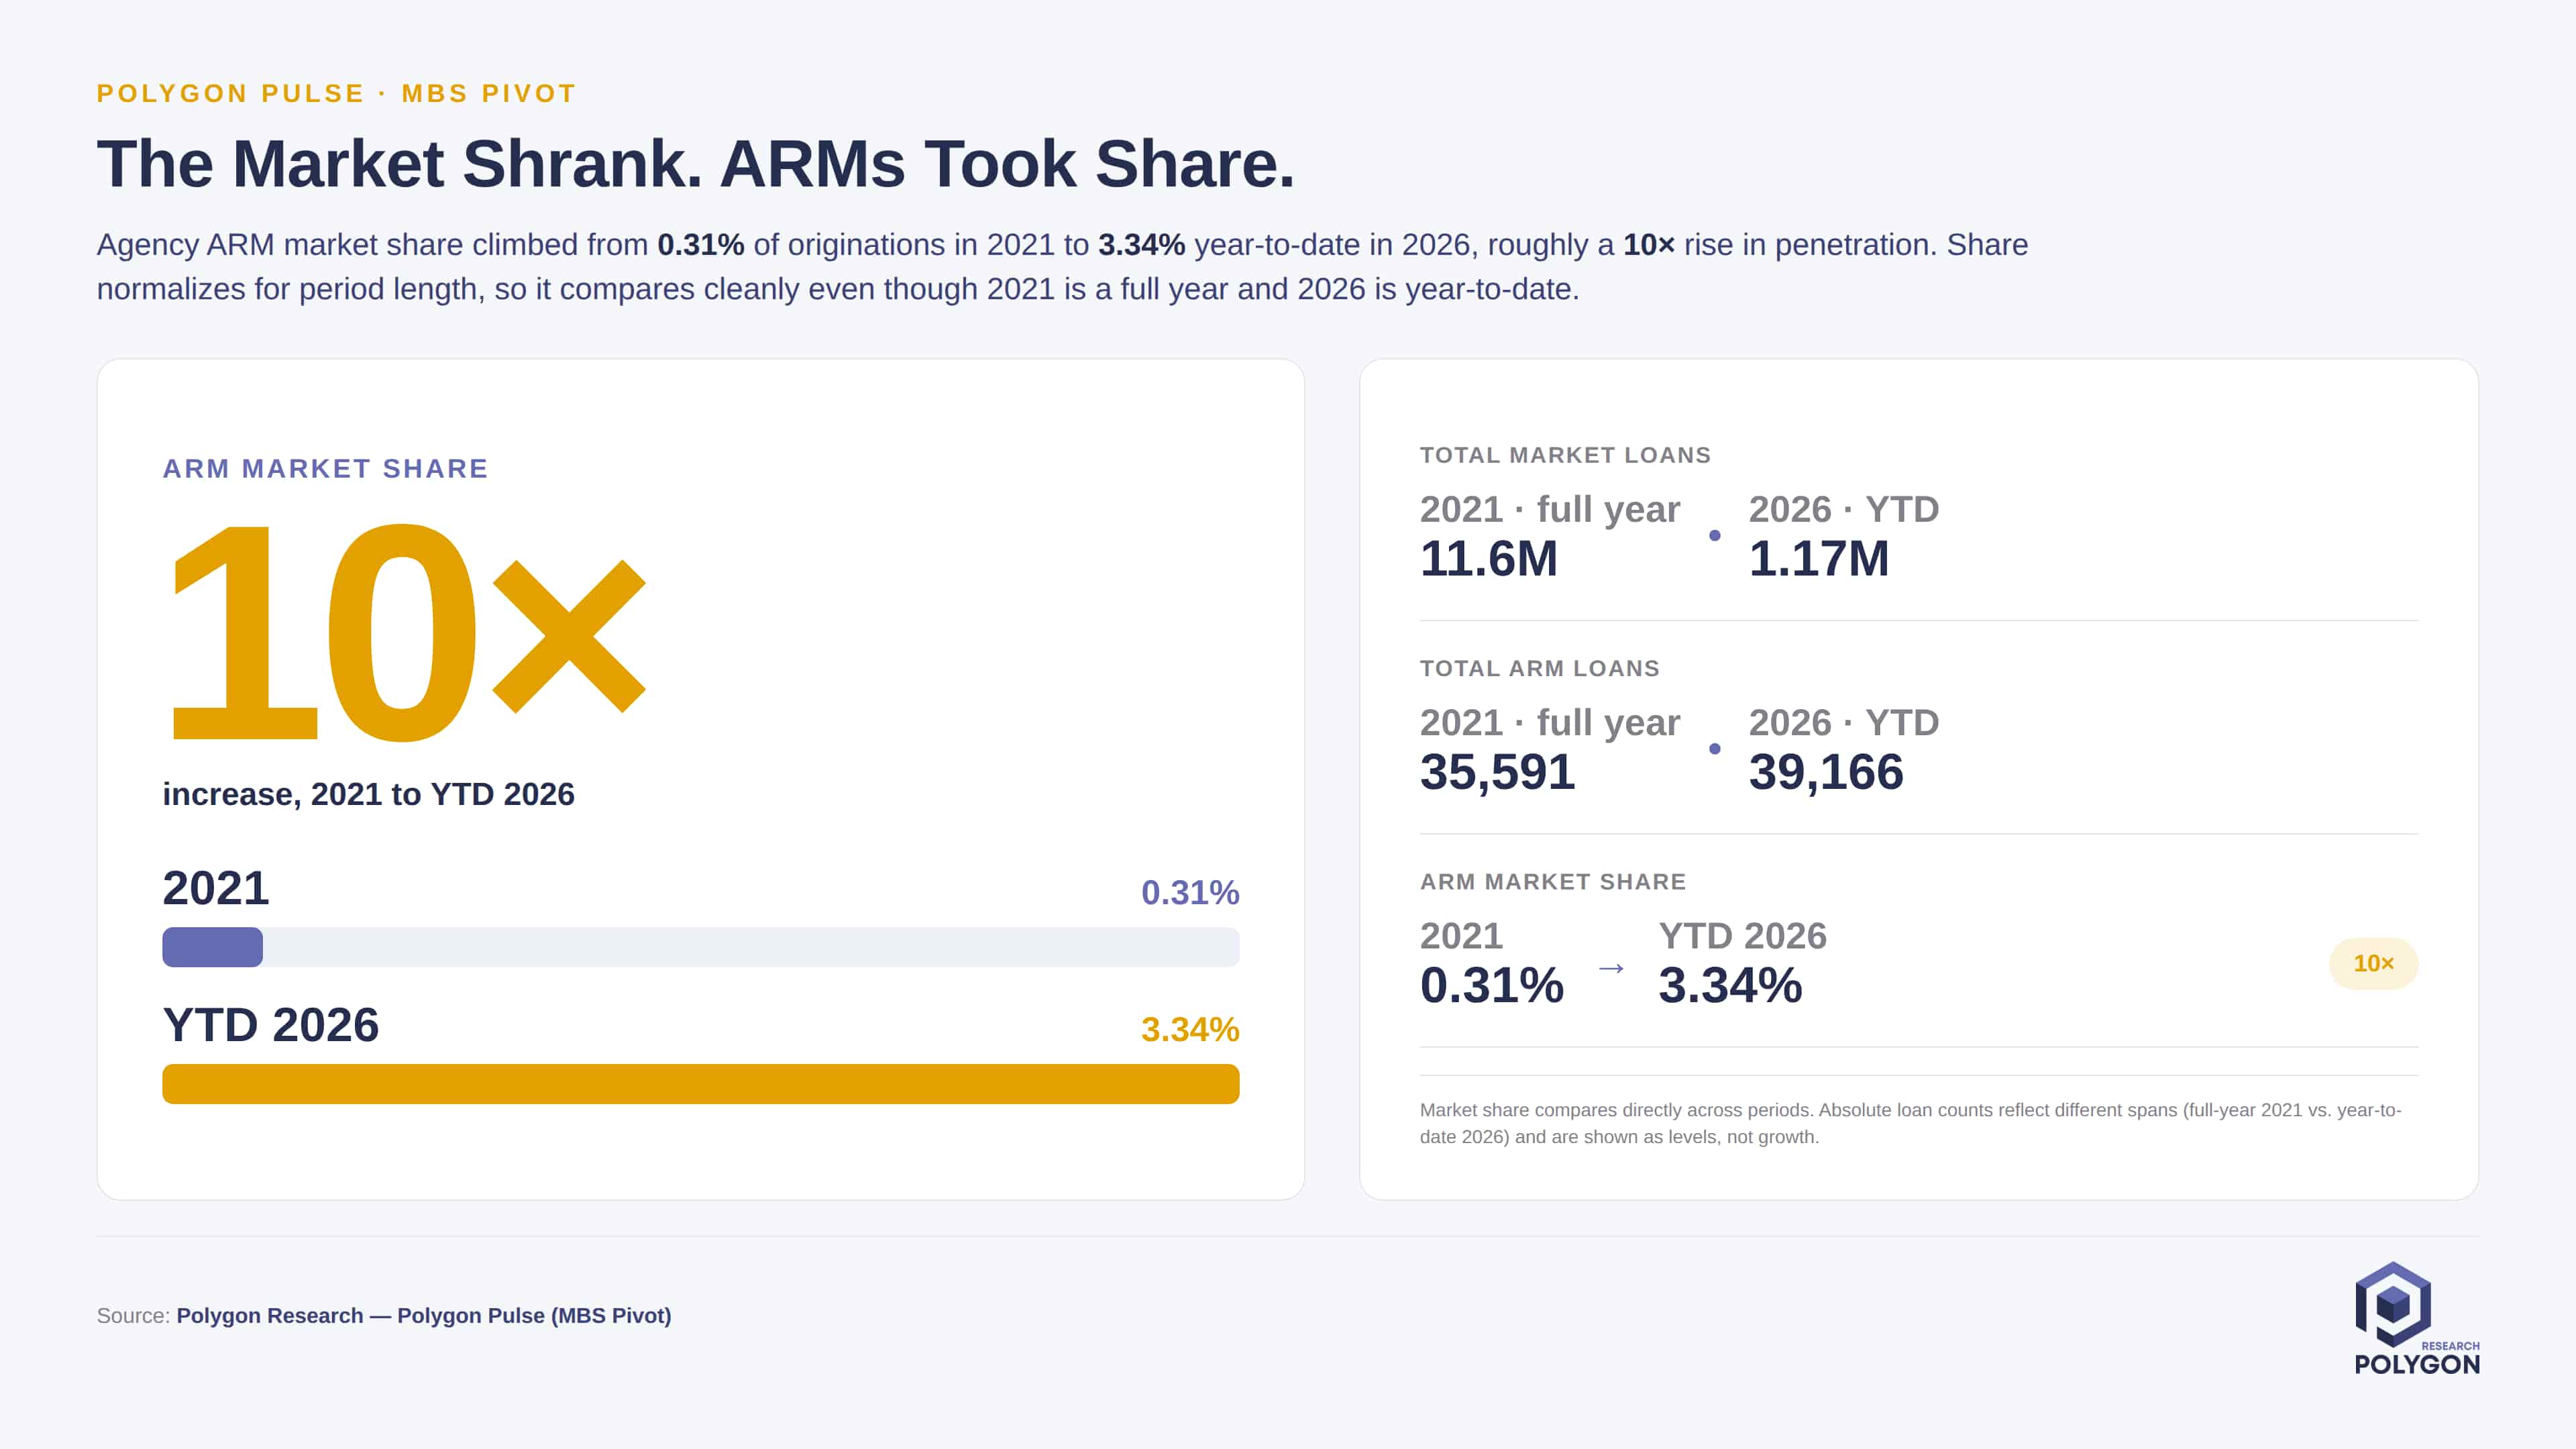
Agency ARMs represent 3.34% of reported 2026 YTD agency originations by loan count, up from 0.31% in full-year 2021. The chart therefore shows roughly a 10× increase in product penetration, not a 10× increase in total ARM production. Reported ARM loan counts were 35,591 in 2021 and 39,166 in 2026 YTD, while total market loan counts shown were 11.6 million and 1.17 million, respectively.

For a geographic view of the trend, see ARM penetration by state.

For lenders, the strategic signal is that ARMs have become materially more relevant within the agency product mix. Product, pricing and capital-markets teams can use the share trend to assess whether ARM offerings, rate sheets, investor outlets, hedging assumptions and sales training remain aligned with market composition. Production leaders can also benchmark their own ARM share against the market rather than compare raw counts across unequal periods. See the agency ARM refinance lender rankings for a lender-level view of the market.

Because 2021 covers a full year and 2026 is year-to-date, the absolute loan counts provide context rather than a direct growth comparison. Market share is the more useful measure for evaluating the change in ARM penetration across the two periods.

From Analysis to Action

This analysis provides a clear blueprint for how to uncover meaningful market dynamics. Its true power is unleashed when you apply this same methodology to your own local markets. Because all real estate is local, this granular approach is essential for crafting precise strategies that effectively address the unique conditions of each community.

Ready to Continue? Get Your Exact Market Answers.

Go beyond generic insights. Polygon's interactive tools and limitless filtering empower you to tailor market data to your specific strategy.
Start your 7-day free trial.
Unlock My Custom Insights Now - Free Trial