Top First-Time Homebuyer Purchase Mortgage Markets by State, YTD 2026

First-Time Homebuyer
Table with YTD 2026 agency purchase mortgage originations for first-time homebuyers by state, with average loan size and interest rate.
Chart Download and Page Share

Share or Download

Data Points
State Name YTD 2026 Avg Loan Amount Avg Rate Texas 17,234 $310,677 5.64% Florida 12,979 $342,262 5.76% California 11,682 $535,404 5.87% Georgia 6,015 $322,427 5.90% North Carolina 5,922 $314,567 5.82% Ohio 5,638 $238,367 6.14% Illinois 5,237 $279,477 6.16% New York 5,130 $417,609 6.07% Pennsylvania 4,985 $280,860 6.11% Arizona 4,972 $375,021 5.68%
Date Published:
May 1, 2026
Date Updated:
May 1, 2026
Chart type:
Table
Suggested Citation:
Polygon Research, “Top First-Time Homebuyer Agency Purchase Mortgage Originations by State, YTD 2026,” Polygon Pulse - MBS Pivot, accessed 2026. Filters: purchase mortgages; first-time homebuyers; agency loans including Ginnie Mae, Fannie Mae, and Freddie Mac; top 10 states by loan count.
Key Insight and Commentary

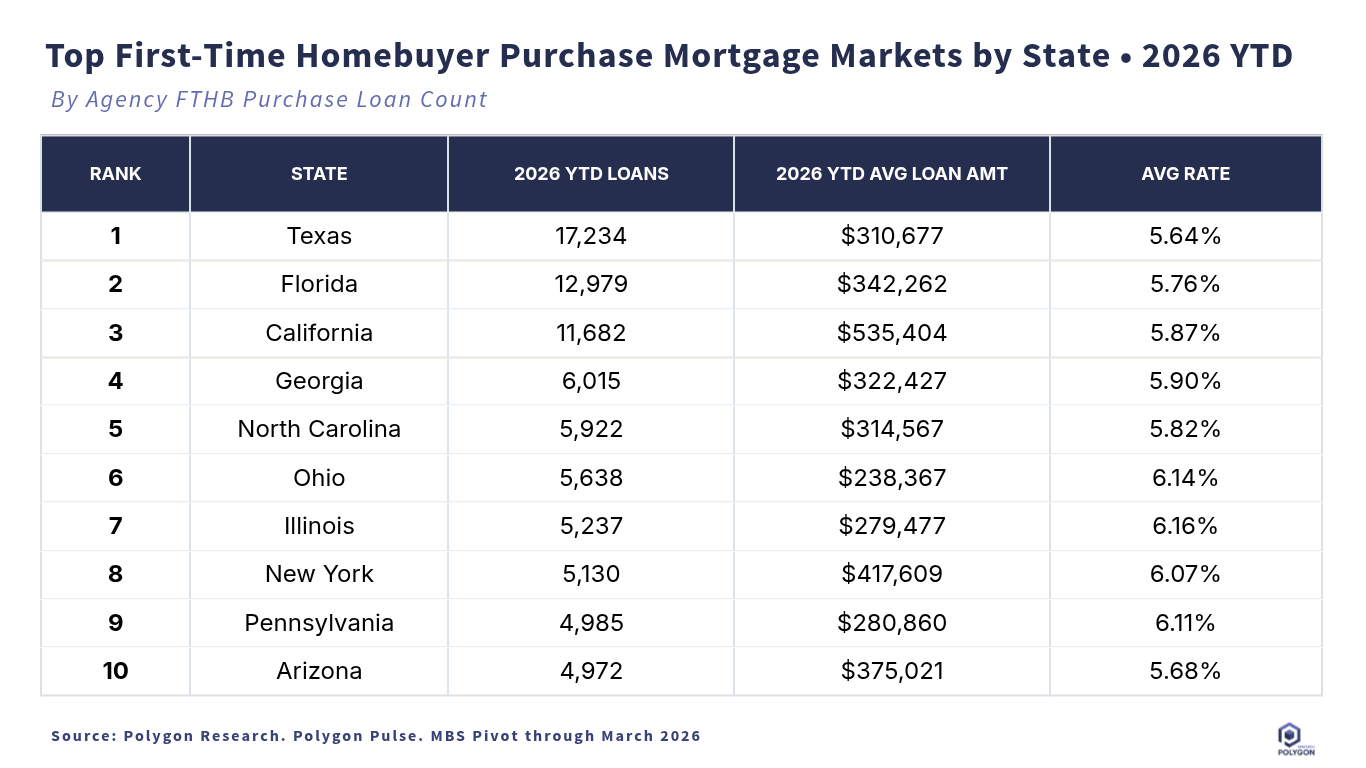
The top-10 states for YTD 2026 first-time homebuyer agency purchase originations show where entry-level demand is still converting into closed loans. Texas leads with 17,234 loans, followed by Florida at 12,979 and California at 11,682.

But the more useful insight is in the mix, not just the ranking. Texas combines the highest loan count with a below-average loan size and rate, suggesting a market where affordability and agency execution are still working at scale. California produces substantial volume, but with an average loan amount above $535,000, the borrower qualification challenge is very different. Ohio, Illinois, Pennsylvania, and New York show higher average rates than the total, which may reflect differences in product mix, credit profile, geography, or channel execution.

For lenders, this chart is a production strategy tool. High-volume states deserve capacity, referral partnerships, builder relationships, and localized pricing discipline. Higher-balance markets require tighter attention to income qualification, LLPAs, jumbo-conforming boundaries, and fallout risk. The point is not to chase volume blindly; it is to understand where first-time buyer demand is financeable, where margins are defendable, and where borrower education can turn affordability pressure into closed loans.

From Analysis to Action

This analysis provides a clear blueprint for how to uncover meaningful market dynamics. Its true power is unleashed when you apply this same methodology to your own local markets. Because all real estate is local, this granular approach is essential for crafting precise strategies that effectively address the unique conditions of each community.

Ready to Continue? Get Your Exact Market Answers.

Go beyond generic insights. Polygon's interactive tools and limitless filtering empower you to tailor market data to your specific strategy.
Start your 7-day free trial.
Unlock My Custom Insights Now - Free Trial