.jpg)
In 2025, the “wait for rates to drop” strategy failed.
Lenders who built their plans around national averages and macro forecasts spent the year reacting. The lenders who performed best did something different. They stopped waiting for the market to change and started competing inside the market that actually existed — loan by loan, borrower by borrower, with pricing, eligibility, and operational constraints fully visible.
We’ve come to think of these institutions as Precision Lenders. They rely less on generalized narratives and more on granular truths: where real affordability exists, which borrowers are still transact-able, which products work under current pricing regimes, and which structural advantages — data, scale, or integration — matter most.
This year-end review distills what we observed across our Polygon Vision, Pulse, and Risk suites, throughout 2025. Our goal is to surface the patterns our weekly charts showed throughout 2025 — patterns that now form a practical roadmap for 2026.
For most of 2025, the prevailing story was that first-time homebuyers had been sidelined. High rates, limited inventory, and affordability pressure were assumed to have pushed them out of the market.
Our data told a different story.
While surveys and sentiment measures suggested first-time buyers accounted for roughly 20% of activity, Polygon Vision (HMDAVision) showed that first-time buyers represented closer to 62% of purchase originations, depending on how the population was defined. The discrepancy wasn’t a rounding error. It was a measurement problem.
The deeper insight is that this was not simply an affordability crisis. It was a shopping revolution.
Our Borrower Shopping Index revealed that Gen Z and Millennial borrowers routinely compared three or more quotes before committing.
Loyalty weakened, not because borrowers became fickle, but because pricing dispersion mattered more in a constrained market. Small differences in fees, points, or credits had outsized effects on decision-making.
This is why our blogs The Great First-Time Homebuyer Affordability Myth and I Thought I Knew What a First-Time Homebuyer Was resonated. They argued that demand didn’t disappear — it fragmented. Lenders who treated first-time buyers as a homogeneous group missed the shift entirely.
Independent mortgage banks should stop leading with rate and start educating around total cost of ownership. Younger borrowers are shopping for feasibility and payment certainty, not just APR.
Credit unions should assume their members are shopping them. Polygon Vision allows you to see where member borrowers are leaking to non-bank lenders and adjust first-time buyer products before those relationships break.
The dominant refinance narrative in 2025 was simple: there would be no meaningful activity until rates fell below a psychological threshold.
Again, the data disagreed.
Polygon Vision revealed a $40.4 billion VA IRRRL opportunity embedded in the 2022–2024 vintages — loans that remained well above prevailing market rates even as the broader rate environment stabilized. Refinance activity did not return uniformly. It persisted in specific MSAs and among specific loan pools.
The lenders who captured this volume were not buying more leads. They were mining data. They identified high-rate cohorts geographically, operationalized outreach, and acted before competitors even saw the opportunity.
The same logic applies to FHA Streamline refinances.
This mattered even more as trigger-lead restrictions moved from policy debate to near-term reality. The impending loss of trigger-lead access forced a strategic fork in the road. Lenders either doubled down on commoditized lead buying while it lasted, or they built defensible, data-driven targeting capabilities.
Our blog 2026 Refinance Surge: How Lenders Can Win made the case plainly: refinance in the next cycle will be lender-specific, not market-wide.
Stop buying leads. Start studying your local markets and mining data. Use Polygon Vision and Polygon Pulse to identify agency loans in your footprint that are 150+ basis points above current rates and reach those borrowers directly — before trigger-lead bans eliminate the shortcut entirely.
Another pattern that repeated across lender-ranking charts was the growing distance between the very largest institutions and everyone else.
In 2025, the Top 5 lenders controlled more than half of refinance volume. More importantly, the gap between the largest platforms and mid-sized lenders widened into what can only be described as a canyon. This wasn’t just about price. It was about operational leverage, distribution control, and recapture economics.
This is where consolidation stopped being background noise and became strategy. Platform acquisitions — combining origination, servicing, and distribution — reduced dependence on market cycles and increased lifetime customer value. Market-share charts reflected this structural advantage long before earnings calls did.
For lenders outside the Top 10, the lesson was uncomfortable but actionable: volume competition is no longer symmetric.
If you are not a Top-10 lender, stop competing on national scale. Compete on niche dominance. Use Polygon Vision to identify MSAs where the largest players have weak physical or relational presence, and invest in local referral networks where scale works against incumbents.
Special Purpose Credit Programs were one of the most closely watched policy-driven initiatives in 2022-2024. Early enthusiasm suggested SPCPs would materially expand access and reshape purchase lending.
What happened in 2025 instead was more instructive.
As we explored in Did Pulte Pull the Plug on SPCP?, SPCPs collided with the same structural constraints shaping the rest of the market: affordability pressure, operational complexity, compliance risk, and reputational scrutiny. In a constrained environment, even well-intentioned programs struggled to persist unless they aligned cleanly with underwriting, pricing, and delivery systems.
The lesson was not that SPCPs “failed.” It was that structure always wins over intent. Programs that require bespoke workflows or sit outside core pricing and risk frameworks are hardest to sustain when margins are tight and scrutiny is high.
Treat SPCPs as part of your core product and pricing architecture, not as a bolt-on initiative. If a program cannot scale operationally in a stressed market, it will not survive a downturn. Dive in the data to discover real opportunities to make an impact.
Finally, while employment remained strong and headline credit performance looked benign, Polygon Risk surfaced early warning signs beneath the surface. At credit unions, serious delinquencies (60+ days) rose counter-seasonally, driven by specific high-LTV conventional vintages rather than broad borrower distress.
The divergence between stable 30-day delinquencies and rising “aging” risk underscored a critical point: macro stability can mask micro fragility. Risk in 2025 was localized, vintage-specific, and easy to miss without loan-level visibility.
Risk teams should perform vintage-level reviews of 2022–2023 originations. Marketing teams should pivot away from high-volatility borrower segments in stressed ZIPs and toward more stable equity-rich profiles where credit performance remains resilient.
If 2025 taught anything about the LO workforce, it’s that “we’re always hiring” isn’t a feeling — it’s a measurable operating condition. When you look beneath production rankings using NMLS licensing data modeled in HMDAVision (2020-2024), the story is less about headcount and more about churn: teams that look stable on paper can be constantly reconstructing in the background.
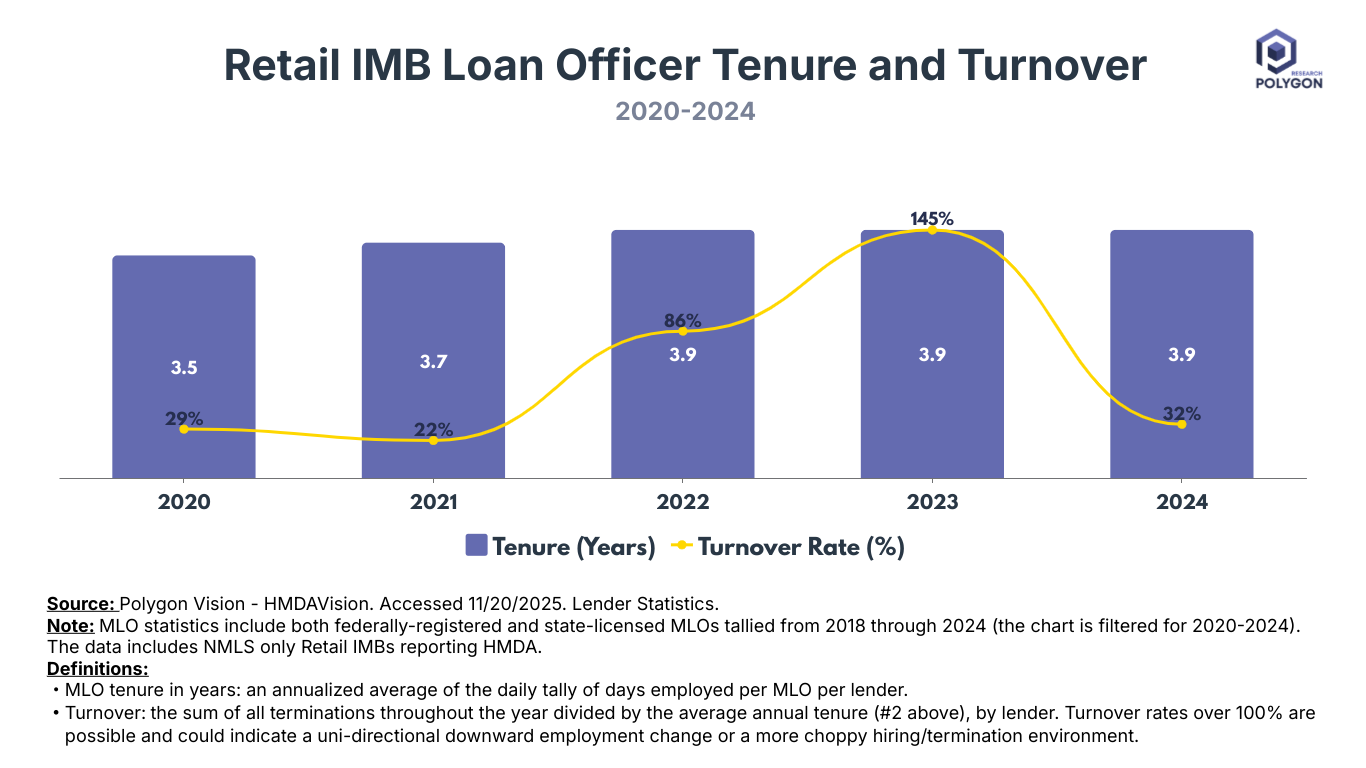
Loan Officer turnover and tenure should be on the same dashboard as production, product mix, pull-through, and borrower shopping. If you don’t measure churn, you’ll keep “solving” symptoms (more recruiting) instead of the system.
If 2025 offered one enduring lesson, it is that markets are shaped less by moments than by mechanisms.
Pricing rules, borrower behavior, product mix decisions, data access, and institutional structure mattered far more than rate forecasts alone.
The lenders who won did not wait. They competed precisely.
In 2026, the advantage will belong to those who can see the market as it is — not as averages suggest, and not as headlines imply — and who build strategies around that reality.
Polygon Research will continue publishing data designed to surface those structures early, while they are still forming, because clarity in this market does not come from patience. It comes from precision.
Discover the 2025 mortgage data hub. From the $40B VA refi opportunity to the truth about Gen Z homebuyers and 2026 strategic tips for IMBs and Credit Unions.
In 2025, the “wait for rates to drop” strategy failed.
Lenders who built their plans around national averages and macro forecasts spent the year reacting. The lenders who performed best did something different. They stopped waiting for the market to change and started competing inside the market that actually existed — loan by loan, borrower by borrower, with pricing, eligibility, and operational constraints fully visible.
We’ve come to think of these institutions as Precision Lenders. They rely less on generalized narratives and more on granular truths: where real affordability exists, which borrowers are still transact-able, which products work under current pricing regimes, and which structural advantages — data, scale, or integration — matter most.
This year-end review distills what we observed across our Polygon Vision, Pulse, and Risk suites, throughout 2025. Our goal is to surface the patterns our weekly charts showed throughout 2025 — patterns that now form a practical roadmap for 2026.
For most of 2025, the prevailing story was that first-time homebuyers had been sidelined. High rates, limited inventory, and affordability pressure were assumed to have pushed them out of the market.
Our data told a different story.
While surveys and sentiment measures suggested first-time buyers accounted for roughly 20% of activity, Polygon Vision (HMDAVision) showed that first-time buyers represented closer to 62% of purchase originations, depending on how the population was defined. The discrepancy wasn’t a rounding error. It was a measurement problem.
The deeper insight is that this was not simply an affordability crisis. It was a shopping revolution.
Our Borrower Shopping Index revealed that Gen Z and Millennial borrowers routinely compared three or more quotes before committing.
Loyalty weakened, not because borrowers became fickle, but because pricing dispersion mattered more in a constrained market. Small differences in fees, points, or credits had outsized effects on decision-making.
This is why our blogs The Great First-Time Homebuyer Affordability Myth and I Thought I Knew What a First-Time Homebuyer Was resonated. They argued that demand didn’t disappear — it fragmented. Lenders who treated first-time buyers as a homogeneous group missed the shift entirely.
Independent mortgage banks should stop leading with rate and start educating around total cost of ownership. Younger borrowers are shopping for feasibility and payment certainty, not just APR.
Credit unions should assume their members are shopping them. Polygon Vision allows you to see where member borrowers are leaking to non-bank lenders and adjust first-time buyer products before those relationships break.
The dominant refinance narrative in 2025 was simple: there would be no meaningful activity until rates fell below a psychological threshold.
Again, the data disagreed.
Polygon Vision revealed a $40.4 billion VA IRRRL opportunity embedded in the 2022–2024 vintages — loans that remained well above prevailing market rates even as the broader rate environment stabilized. Refinance activity did not return uniformly. It persisted in specific MSAs and among specific loan pools.
The lenders who captured this volume were not buying more leads. They were mining data. They identified high-rate cohorts geographically, operationalized outreach, and acted before competitors even saw the opportunity.
The same logic applies to FHA Streamline refinances.
This mattered even more as trigger-lead restrictions moved from policy debate to near-term reality. The impending loss of trigger-lead access forced a strategic fork in the road. Lenders either doubled down on commoditized lead buying while it lasted, or they built defensible, data-driven targeting capabilities.
Our blog 2026 Refinance Surge: How Lenders Can Win made the case plainly: refinance in the next cycle will be lender-specific, not market-wide.
Stop buying leads. Start studying your local markets and mining data. Use Polygon Vision and Polygon Pulse to identify agency loans in your footprint that are 150+ basis points above current rates and reach those borrowers directly — before trigger-lead bans eliminate the shortcut entirely.
Another pattern that repeated across lender-ranking charts was the growing distance between the very largest institutions and everyone else.
In 2025, the Top 5 lenders controlled more than half of refinance volume. More importantly, the gap between the largest platforms and mid-sized lenders widened into what can only be described as a canyon. This wasn’t just about price. It was about operational leverage, distribution control, and recapture economics.
This is where consolidation stopped being background noise and became strategy. Platform acquisitions — combining origination, servicing, and distribution — reduced dependence on market cycles and increased lifetime customer value. Market-share charts reflected this structural advantage long before earnings calls did.
For lenders outside the Top 10, the lesson was uncomfortable but actionable: volume competition is no longer symmetric.
If you are not a Top-10 lender, stop competing on national scale. Compete on niche dominance. Use Polygon Vision to identify MSAs where the largest players have weak physical or relational presence, and invest in local referral networks where scale works against incumbents.
Special Purpose Credit Programs were one of the most closely watched policy-driven initiatives in 2022-2024. Early enthusiasm suggested SPCPs would materially expand access and reshape purchase lending.
What happened in 2025 instead was more instructive.
As we explored in Did Pulte Pull the Plug on SPCP?, SPCPs collided with the same structural constraints shaping the rest of the market: affordability pressure, operational complexity, compliance risk, and reputational scrutiny. In a constrained environment, even well-intentioned programs struggled to persist unless they aligned cleanly with underwriting, pricing, and delivery systems.
The lesson was not that SPCPs “failed.” It was that structure always wins over intent. Programs that require bespoke workflows or sit outside core pricing and risk frameworks are hardest to sustain when margins are tight and scrutiny is high.
Treat SPCPs as part of your core product and pricing architecture, not as a bolt-on initiative. If a program cannot scale operationally in a stressed market, it will not survive a downturn. Dive in the data to discover real opportunities to make an impact.
Finally, while employment remained strong and headline credit performance looked benign, Polygon Risk surfaced early warning signs beneath the surface. At credit unions, serious delinquencies (60+ days) rose counter-seasonally, driven by specific high-LTV conventional vintages rather than broad borrower distress.
The divergence between stable 30-day delinquencies and rising “aging” risk underscored a critical point: macro stability can mask micro fragility. Risk in 2025 was localized, vintage-specific, and easy to miss without loan-level visibility.
Risk teams should perform vintage-level reviews of 2022–2023 originations. Marketing teams should pivot away from high-volatility borrower segments in stressed ZIPs and toward more stable equity-rich profiles where credit performance remains resilient.
If 2025 taught anything about the LO workforce, it’s that “we’re always hiring” isn’t a feeling — it’s a measurable operating condition. When you look beneath production rankings using NMLS licensing data modeled in HMDAVision (2020-2024), the story is less about headcount and more about churn: teams that look stable on paper can be constantly reconstructing in the background.
Loan Officer turnover and tenure should be on the same dashboard as production, product mix, pull-through, and borrower shopping. If you don’t measure churn, you’ll keep “solving” symptoms (more recruiting) instead of the system.
If 2025 offered one enduring lesson, it is that markets are shaped less by moments than by mechanisms.
Pricing rules, borrower behavior, product mix decisions, data access, and institutional structure mattered far more than rate forecasts alone.
The lenders who won did not wait. They competed precisely.
In 2026, the advantage will belong to those who can see the market as it is — not as averages suggest, and not as headlines imply — and who build strategies around that reality.
Polygon Research will continue publishing data designed to surface those structures early, while they are still forming, because clarity in this market does not come from patience. It comes from precision.