

Every year, a wave of content gets published about Hispanic homeownership. Most of it describes the same macro trends — a growing population, rising homeownership rates, a significant wealth-building opportunity — and stops there. It's accurate. It's also not particularly useful if you're an LO in Indianapolis trying to figure out what to actually do on Monday morning.
This piece is an attempt to be more specific. The Polygon Affordability Index, developed in partnership with NAHREP and featured in the 2025 State of Hispanic Homeownership Report, ranked the top 25 opportunity markets for Hispanic homebuyers using actual HMDA loan-level transaction data. The ranking tells you where the opportunity is. We want to tell you what to do with it.
Most affordability measures rely on median household income estimates and median home price data — broad assumptions that smooth over the actual experience of real borrowers. The Polygon Affordability Index is built differently. It uses loan-level data from HMDA, which means it reflects what actually happened in actual mortgage transactions, not what a model assumes happened.
The index scores markets on a 0–100 scale (higher = more affordable) using three components, weighted to reflect how borrowers actually experience housing costs:
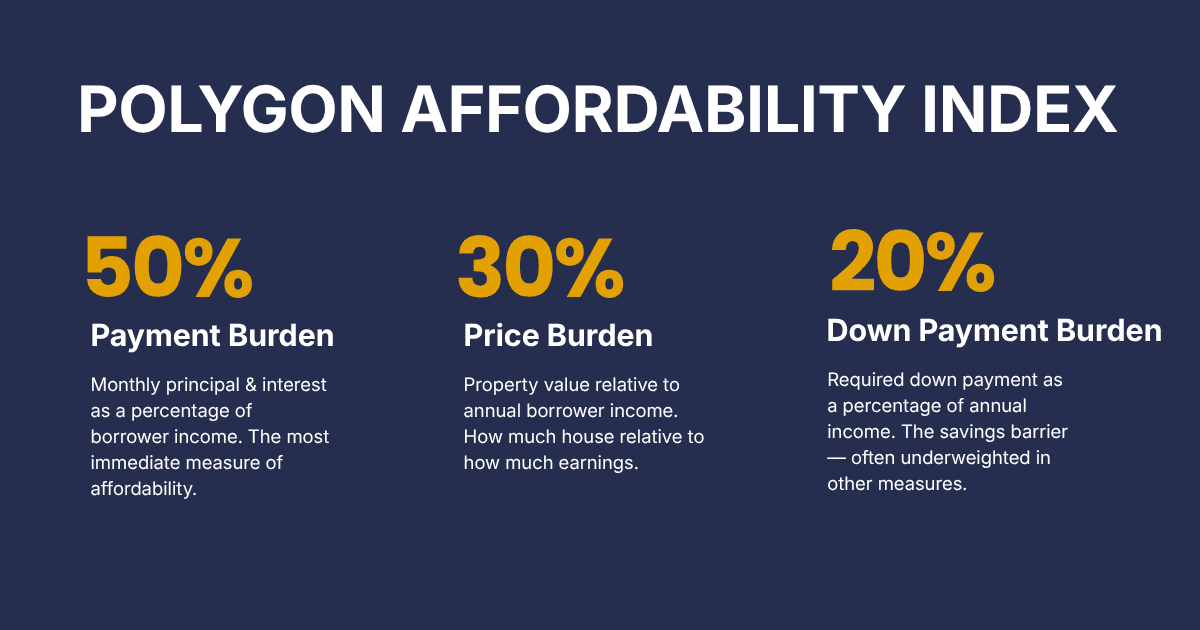
Crucially, this index was constructed specifically for Hispanic borrowers — using only loan transactions by Hispanic or Latino borrowers, filtered to fixed-rate, first-lien, closed-end purchase loans on 1–4 family primary residences. It doesn't assume Hispanic borrowers behave like the average American homebuyer. It measures what they actually experienced.
Here is the full ranking as featured in the NAHREP report, along with the key metrics behind each score.

A few patterns jump out immediately when you look at this table as a business intelligence tool rather than an academic ranking.
Sixteen of the top 25 markets are in Texas. The instinct is to attribute this to demographics — Texas has a large Hispanic population. But demographics don't explain affordability. What explains it is the combination of relatively lower home prices, higher Hispanic homebuyer incomes in certain markets, and transaction volumes large enough to produce reliable data. McAllen has 841,000 Hispanic residents and a PAI score of 70. El Paso has 726,000 and scores 72. These are large, deep markets with genuine affordability — not just big numbers.
"San Antonio has 1.5 million Hispanic residents and scores 62 on the PAI. That's the largest Hispanic market on this list — and it ranks 25th on affordability."
That gap between population size and affordability rank is where the real strategic insight lives. San Antonio is a market with enormous Hispanic population but meaningfully lower affordability than smaller Texas metros. For an LO in San Antonio, the down payment burden (37.5%) and price burden (3.1x income) are the specific friction points to address — not the borrower pool size.
Indianapolis ranks first. Pittsburgh ranks fifth. Buffalo ranks tenth. Detroit sixteenth. Rockford eighteenth. These are not markets that typically anchor conversations about Hispanic homeownership opportunity — but the data is clear. Indianapolis has a PAI score of 81, the highest on the entire list, driven by a payment burden of just 13.6% of borrower income. That means a Hispanic borrower in Indianapolis is devoting less of their monthly income to mortgage payments than in almost any other major market in the country.
For LOs and agents in these markets, this list is validation. The opportunity is real, it's measurable, and most of your competitors aren't paying attention to it.
The table above is the radar. Turning it into a strategy requires asking the right questions about your specific market. Here are the three that matter most.
The PAI breaks affordability into three components — and they point to different problems. A high payment burden means the monthly math is hard: your conversation needs to focus on rate buydowns, loan sizing, and realistic purchase price. A high price burden means the market itself is expensive relative to incomes: longer savings timelines and income growth matter. A high down payment burden — which is the constraint in markets like College Station (56.6%), Albany (55.6%), Detroit (50.0%), and Buffalo (48.6%) — means the monthly payment actually pencils out, but the borrower can't get to the closing table. In those markets, down payment assistance programs, gift fund documentation, and equity-out strategies for existing homeowners should be standard parts of your toolkit, not last resorts.
If you're an LO in Indianapolis, Pittsburgh, Buffalo, Detroit, or Rockford, you are sitting on a credible, third-party-validated story that most of your market has never heard: this is one of the best markets in the country for Hispanic homebuyers right now. That's a referral partner conversation. A Realtor presentation. A community event hook. A social post that actually says something. Most content targeting Hispanic homebuyers leads with national statistics. You can lead with their market — by name, with data behind it.
In large Texas border markets — McAllen, El Paso, Laredo, Brownsville — competition is higher and transaction volume is deep. Differentiation comes from product fluency. As we'll cover in more detail in an upcoming post, Hispanic borrowers are increasingly finding paths to homeownership through FHA and Non-QM channels that conventional underwriting doesn't accommodate well. An LO who can navigate those channels confidently — explaining the tradeoffs, not just steering toward them — is a fundamentally different value proposition than one who defaults to conventional and hopes for the best.
"If your market isn't on this list, that's also information. Affordability conditions for Hispanic borrowers in your market are more challenging — and your strategy needs to reflect that."
The PAI measures affordability at the point of transaction — it reflects the experience of borrowers who successfully originated loans. It does not measure the experience of borrowers who applied and were denied, or who never applied because they assumed they wouldn't qualify. Those populations are harder to see in HMDA but equally important. The pull-through gap between Hispanic and non-Hispanic borrowers on conventional loans — a separate finding from our HMDA analysis — is a reminder that affordability and access are related but distinct challenges.
The Polygon Affordability Index featured in the NAHREP report is based on 2024 HMDA data — the most recently available data under the standard HMDA reporting cycle, released March 31, 2025. The 2025 HMDA data is expected imminently. When it's released, Polygon Research will publish an updated analysis showing how these market rankings have shifted — and which new markets have entered or left the opportunity tier. If you want to be among the first to see it, the best way is to follow us or reach out directly.
The full Polygon Affordability Index is interactive inside HMDAVision — filterable by market, income tier, ethnicity, and loan type. See how your market compares.
Which U.S. markets are most affordable for Hispanic homebuyers? HMDA-based rankings plus specific moves for loan originators and real estate agents.
Every year, a wave of content gets published about Hispanic homeownership. Most of it describes the same macro trends — a growing population, rising homeownership rates, a significant wealth-building opportunity — and stops there. It's accurate. It's also not particularly useful if you're an LO in Indianapolis trying to figure out what to actually do on Monday morning.
This piece is an attempt to be more specific. The Polygon Affordability Index, developed in partnership with NAHREP and featured in the 2025 State of Hispanic Homeownership Report, ranked the top 25 opportunity markets for Hispanic homebuyers using actual HMDA loan-level transaction data. The ranking tells you where the opportunity is. We want to tell you what to do with it.
Most affordability measures rely on median household income estimates and median home price data — broad assumptions that smooth over the actual experience of real borrowers. The Polygon Affordability Index is built differently. It uses loan-level data from HMDA, which means it reflects what actually happened in actual mortgage transactions, not what a model assumes happened.
The index scores markets on a 0–100 scale (higher = more affordable) using three components, weighted to reflect how borrowers actually experience housing costs:
Crucially, this index was constructed specifically for Hispanic borrowers — using only loan transactions by Hispanic or Latino borrowers, filtered to fixed-rate, first-lien, closed-end purchase loans on 1–4 family primary residences. It doesn't assume Hispanic borrowers behave like the average American homebuyer. It measures what they actually experienced.
Here is the full ranking as featured in the NAHREP report, along with the key metrics behind each score.
A few patterns jump out immediately when you look at this table as a business intelligence tool rather than an academic ranking.
Sixteen of the top 25 markets are in Texas. The instinct is to attribute this to demographics — Texas has a large Hispanic population. But demographics don't explain affordability. What explains it is the combination of relatively lower home prices, higher Hispanic homebuyer incomes in certain markets, and transaction volumes large enough to produce reliable data. McAllen has 841,000 Hispanic residents and a PAI score of 70. El Paso has 726,000 and scores 72. These are large, deep markets with genuine affordability — not just big numbers.
"San Antonio has 1.5 million Hispanic residents and scores 62 on the PAI. That's the largest Hispanic market on this list — and it ranks 25th on affordability."
That gap between population size and affordability rank is where the real strategic insight lives. San Antonio is a market with enormous Hispanic population but meaningfully lower affordability than smaller Texas metros. For an LO in San Antonio, the down payment burden (37.5%) and price burden (3.1x income) are the specific friction points to address — not the borrower pool size.
Indianapolis ranks first. Pittsburgh ranks fifth. Buffalo ranks tenth. Detroit sixteenth. Rockford eighteenth. These are not markets that typically anchor conversations about Hispanic homeownership opportunity — but the data is clear. Indianapolis has a PAI score of 81, the highest on the entire list, driven by a payment burden of just 13.6% of borrower income. That means a Hispanic borrower in Indianapolis is devoting less of their monthly income to mortgage payments than in almost any other major market in the country.
For LOs and agents in these markets, this list is validation. The opportunity is real, it's measurable, and most of your competitors aren't paying attention to it.
The table above is the radar. Turning it into a strategy requires asking the right questions about your specific market. Here are the three that matter most.
The PAI breaks affordability into three components — and they point to different problems. A high payment burden means the monthly math is hard: your conversation needs to focus on rate buydowns, loan sizing, and realistic purchase price. A high price burden means the market itself is expensive relative to incomes: longer savings timelines and income growth matter. A high down payment burden — which is the constraint in markets like College Station (56.6%), Albany (55.6%), Detroit (50.0%), and Buffalo (48.6%) — means the monthly payment actually pencils out, but the borrower can't get to the closing table. In those markets, down payment assistance programs, gift fund documentation, and equity-out strategies for existing homeowners should be standard parts of your toolkit, not last resorts.
If you're an LO in Indianapolis, Pittsburgh, Buffalo, Detroit, or Rockford, you are sitting on a credible, third-party-validated story that most of your market has never heard: this is one of the best markets in the country for Hispanic homebuyers right now. That's a referral partner conversation. A Realtor presentation. A community event hook. A social post that actually says something. Most content targeting Hispanic homebuyers leads with national statistics. You can lead with their market — by name, with data behind it.
In large Texas border markets — McAllen, El Paso, Laredo, Brownsville — competition is higher and transaction volume is deep. Differentiation comes from product fluency. As we'll cover in more detail in an upcoming post, Hispanic borrowers are increasingly finding paths to homeownership through FHA and Non-QM channels that conventional underwriting doesn't accommodate well. An LO who can navigate those channels confidently — explaining the tradeoffs, not just steering toward them — is a fundamentally different value proposition than one who defaults to conventional and hopes for the best.
"If your market isn't on this list, that's also information. Affordability conditions for Hispanic borrowers in your market are more challenging — and your strategy needs to reflect that."
The PAI measures affordability at the point of transaction — it reflects the experience of borrowers who successfully originated loans. It does not measure the experience of borrowers who applied and were denied, or who never applied because they assumed they wouldn't qualify. Those populations are harder to see in HMDA but equally important. The pull-through gap between Hispanic and non-Hispanic borrowers on conventional loans — a separate finding from our HMDA analysis — is a reminder that affordability and access are related but distinct challenges.
The Polygon Affordability Index featured in the NAHREP report is based on 2024 HMDA data — the most recently available data under the standard HMDA reporting cycle, released March 31, 2025. The 2025 HMDA data is expected imminently. When it's released, Polygon Research will publish an updated analysis showing how these market rankings have shifted — and which new markets have entered or left the opportunity tier. If you want to be among the first to see it, the best way is to follow us or reach out directly.
The full Polygon Affordability Index is interactive inside HMDAVision — filterable by market, income tier, ethnicity, and loan type. See how your market compares.
Most affordability measures rely on median household income estimates and median home price data broad assumptions that smooth over the actual experience of real borrowers. The Polygon Affordability Index uses loan-level data from HMDA, reflecting what actually happened in real mortgage transactions. It scores markets on a 0–100 scale using three components weighted to reflect how borrowers experience housing costs: payment burden, price burden, and down payment burden. Critically, it was built specifically for Hispanic borrowers — using only loan transactions by Hispanic or Latino borrowers filtered to fixed-rate, first-lien, closed-end purchase loans on 1–4 family primary residences.
Indianapolis ranked first with a PAI score of 81, driven by a mortgage payment burden of just 13.6% of borrower income. Midwestern markets including Pittsburgh (5th), Buffalo (10th), Detroit (16th), and Rockford (18th) also ranked highly markets not typically associated with Hispanic homeownership opportunity. Sixteen of the top 25 markets are in Texas, where the combination of relatively lower home prices, higher Hispanic homebuyer incomes in certain markets, and deep transaction volumes results in affordability. Texas leaders include El Paso (PAI 72) and McAllen (PAI 70).
Population size and affordability are distinct. San Antonio has 1.5 million Hispanic residents the largest Hispanic market on the list yet ranks 25th on affordability with a PAI score of 62. Its down payment burden of 37.5% and price burden of 3.1x income are the specific friction points constraining borrowers, regardless of market size. The gap between population rank and affordability rank is where the real strategic insight for loan originators lives: a large borrower pool does not mean the path to closing is easy.
The PAI's three components point to different problems requiring different solutions. A high payment burden calls for conversations about rate buydowns, loan sizing, and realistic purchase price. A high price burden suggests longer savings timelines and income growth strategies. A high down payment burden the primary constraint in markets like College Station (56.6%), Albany (55.6%), Detroit (50.0%), and Buffalo (48.6%) means down payment assistance programs, gift fund documentation, and equity-out strategies should be standard tools, not last resorts. LOs in top-ranked Midwestern markets also have a differentiated story to tell: third-party-validated data showing their market is among the best in the country for Hispanic homebuyers useful for referral partner conversations, Realtor presentations, and community outreach.