ARM Rates by Mortgage Loan Type
Loan Pricing
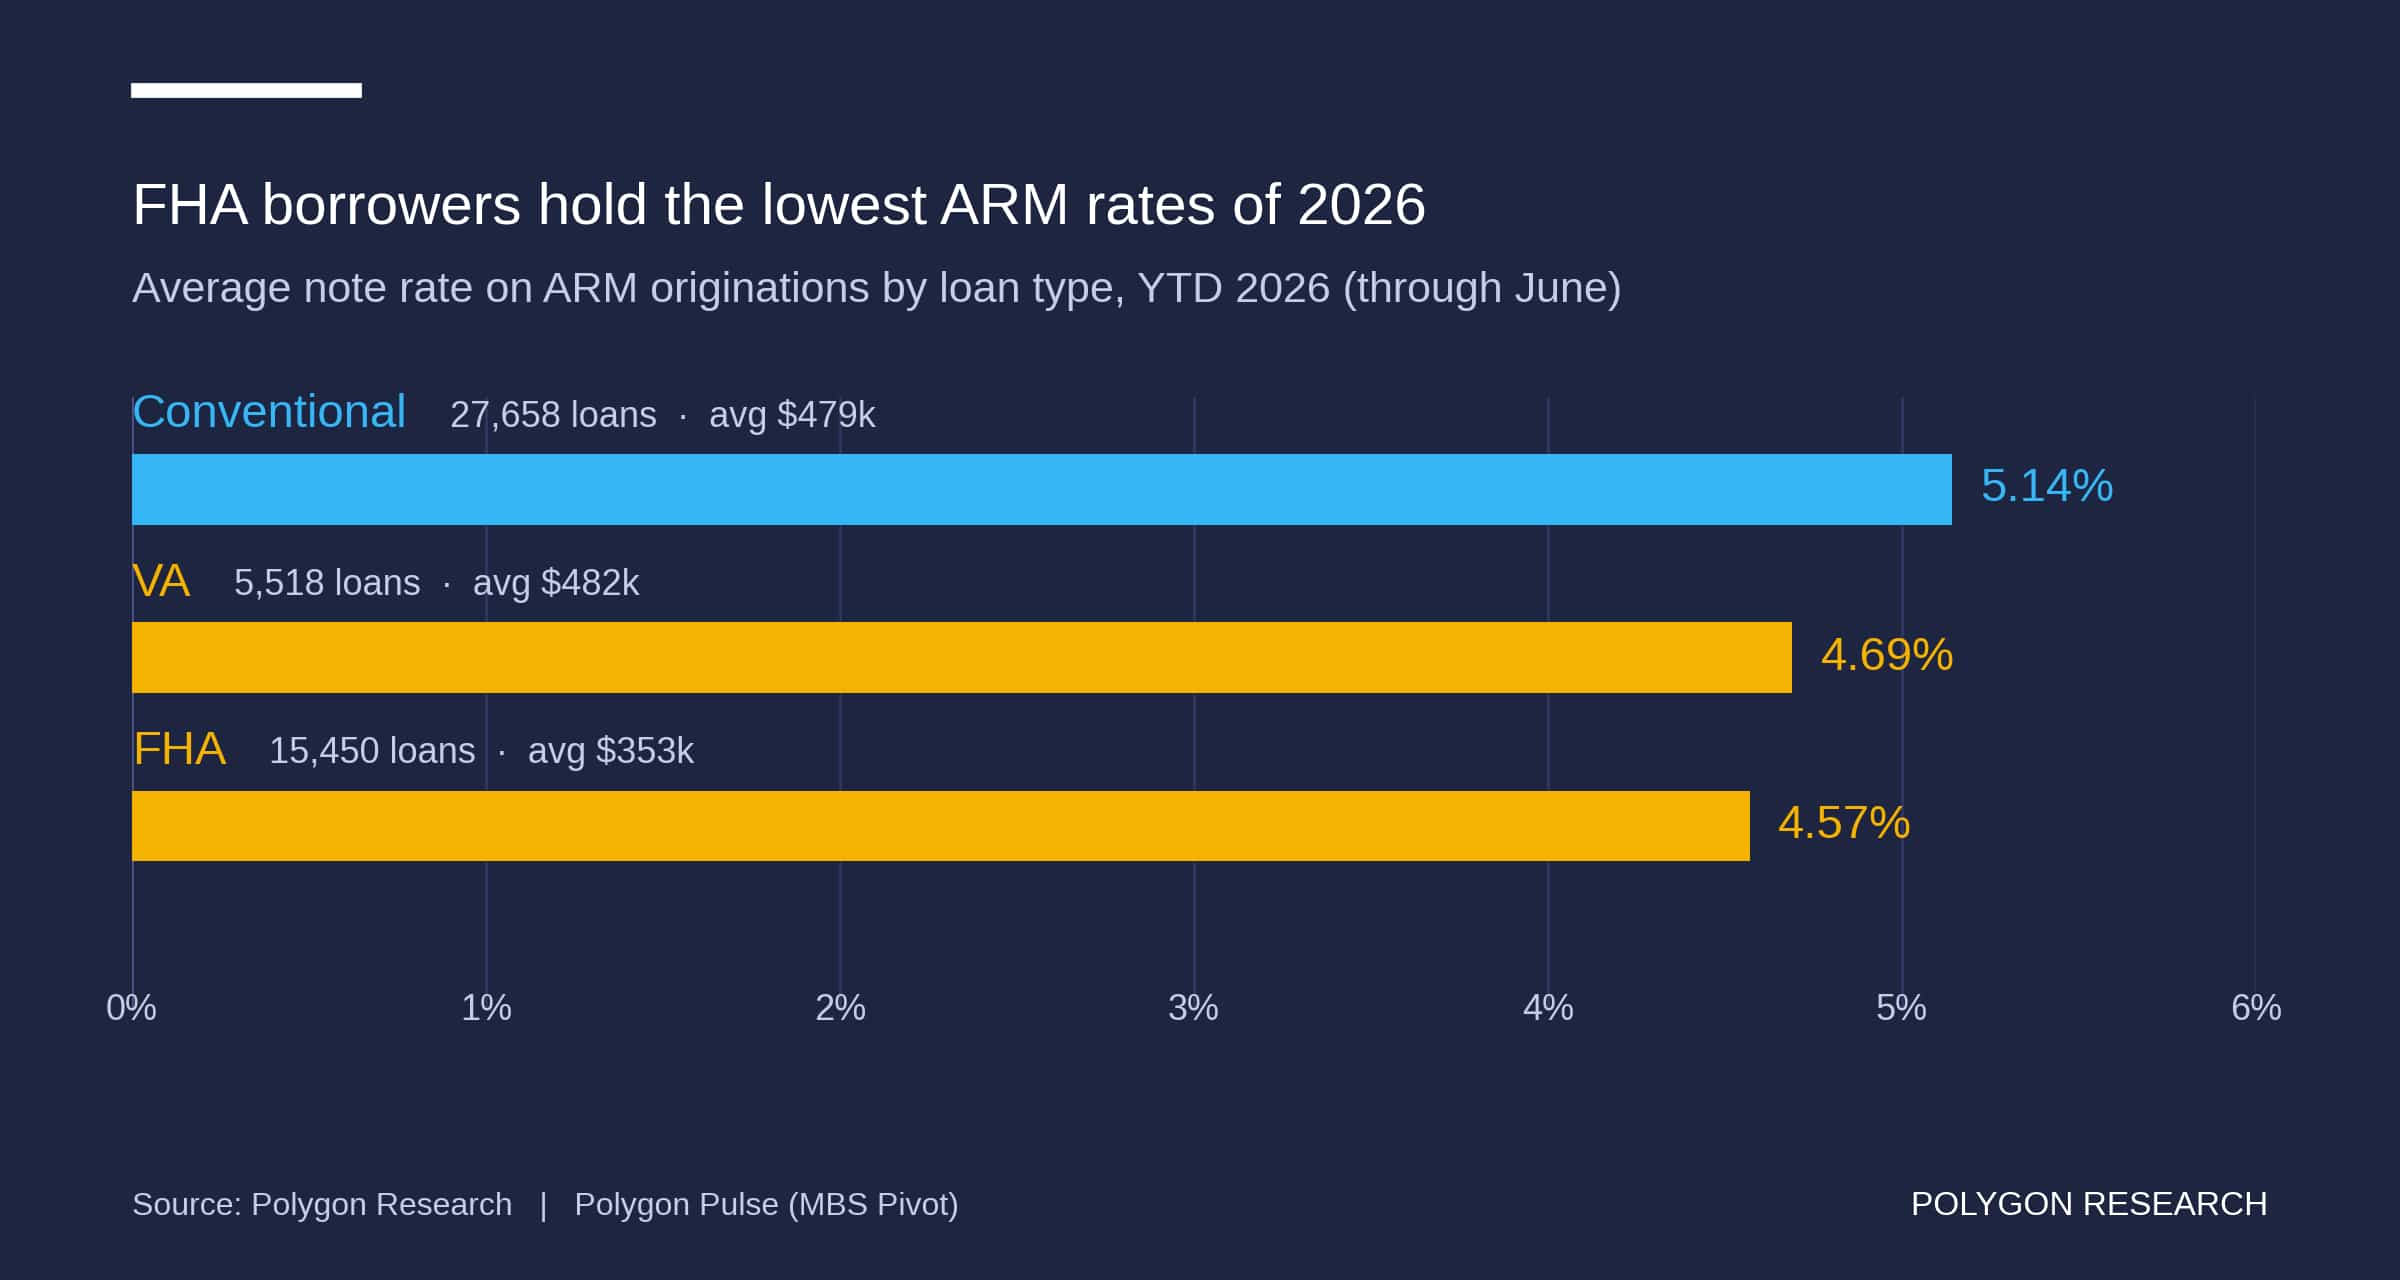
Horizontal bar chart of 2026 YTD average ARM note rates by loan type, showing FHA lowest at 4.57%, followed by VA and conventional.
Chart Download and Page Share

Share or Download

Data Points
Loan Type | Average Note Rate | Loan Count | Average Loan Amount Conventional | 5.14% | 27,658 loans | avg $479k VA | 4.69% | 5,518 loans | avg $482k FHA | 4.57% | 15,450 loans | avg $353k
Which mortgage loan type has the lowest ARM rate?
FHA borrowers have the lowest average ARM note rate among the loan types shown.
Date Published:
July 17, 2026
Date Updated:
July 17, 2026
Chart type:
Bar Chart
Suggested Citation:
Polygon Research, “Average Note Rate on ARM Originations by Loan Type: 2026 YTD Through June,” Polygon Pulse (MBS Pivot), published or updated [NEEDED: exact publication/update date]. Data through June 2026. Scope: conventional, VA and FHA ARM originations. Metric: average note rate (%); chart also reports loan count and average loan amount. Accessed July 17, 2026.
Key insights

FHA borrowers had the lowest average note rate on ARM originations in the chart: 4.57% for 2026 YTD through June. VA ARMs averaged 4.69%, while conventional ARMs averaged 5.14%. The comparison measures average note rates on reported ARM originations by loan type, not advertised rates, ARM margins, adjustment terms or lifetime borrowing costs.

Conventional volume was largest at 27,658 loans, compared with 15,450 FHA loans and 5,518 VA loans. Average loan amounts were $478,845 for conventional, $482,421 for VA and $352,529

for FHA. The lowest average rate therefore did not coincide with either the highest average loan amount or the largest loan count.

Pricing and capital-markets teams can use these observed averages to benchmark product positioning, monitor pipeline mix and test program-level execution assumptions. Production leaders can pair rates with counts and balances when setting ARM channel priorities. For deeper analysis by borrower credit, LTV, geography, loan purpose, ARM structure and other loan-level characteristics, subscribers can log in to MBS Pivot.

From Analysis to Action

This analysis provides a clear blueprint for how to uncover meaningful market dynamics. Its true power is unleashed when you apply this same methodology to your own local markets. Because all real estate is local, this granular approach is essential for crafting precise strategies that effectively address the unique conditions of each community.

Ready to Continue? Get Your Exact Market Answers.

Go beyond generic insights. Polygon's interactive tools and limitless filtering empower you to tailor market data to your specific strategy.
Start your 7-day free trial.
Unlock My Custom Insights Now - Free Trial