Mortgage use case · Peer benchmarking
See what peers are doing differently and where to move next.
Compare market share, product mix, pricing, pull-through, borrower reach and local performance across the lenders and markets that matter to your business.
REAL PRODUCT VIEW
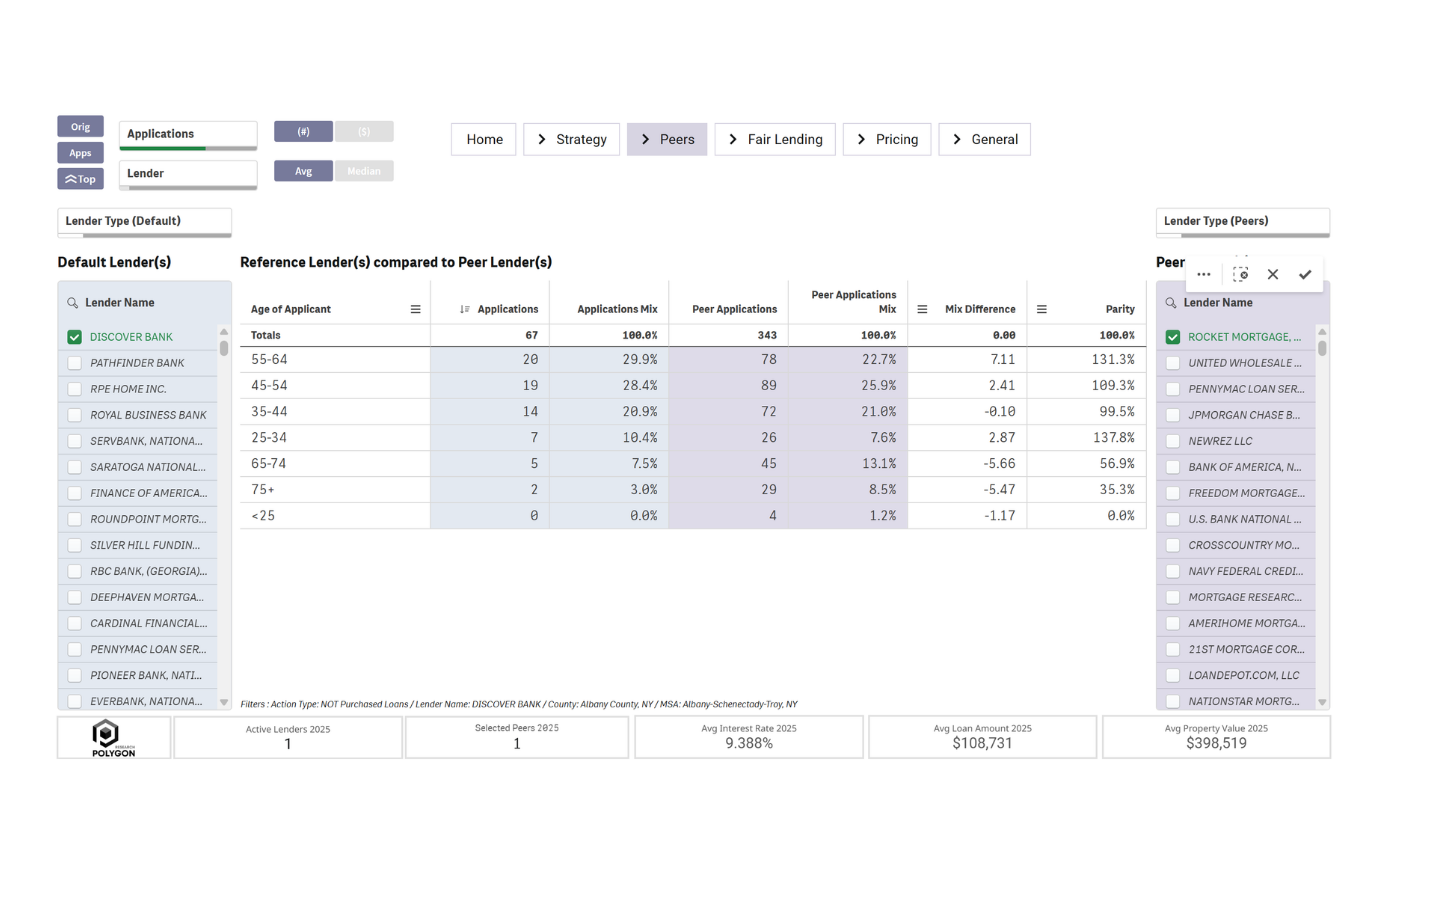
Your lender. Your peer set. One clear comparison.
Put your performance beside a selected peer and the market—then see where the difference begins.
WHY IT MATTERS
The value is in explaining the difference.
See why results differ and which differences can be acted on.
Explore HMDAVision →Choose the peers that matter.Compare the institutions you actually compete with—not a generic national average.
Keep the comparison honest.Use the same market, period, loan population and definitions.
Go beneath market share.Compare pull-through, product mix, pricing, borrower reach and local performance.
MARKET SHARE · PULL-THROUGH · PRODUCT MIX · PRICING · BORROWER REACH · GEOGRAPHY
SEE WHERE THE GAP LIVES
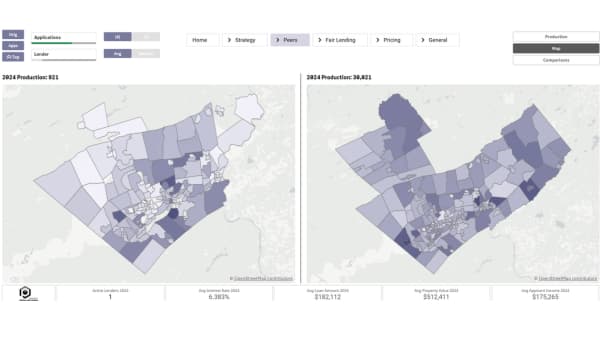
A national ranking flattens the story.
Two lenders can post similar totals and compete in completely different places. Map your footprint against a selected peer to see where you lead, where you are absent and where share is shifting.
DEFENDMarkets where your position is strong.
EXPANDMarkets where demand exists but your reach is thin.
INVESTIGATEMarkets where a peer is winning differently.
FROM ANALYSIS TO ACTION
Take the comparison into the meeting.
A good benchmark should answer three questions quickly: Where are we behind? What is driving it? What should we do next?
01Show what changed. Market share, rank, pull-through and local performance.
02Explain the difference. Product, borrower, pricing and geographic mix.
03Make the next move visible. The markets and segments that deserve attention.
COMPARABLE BY DESIGN
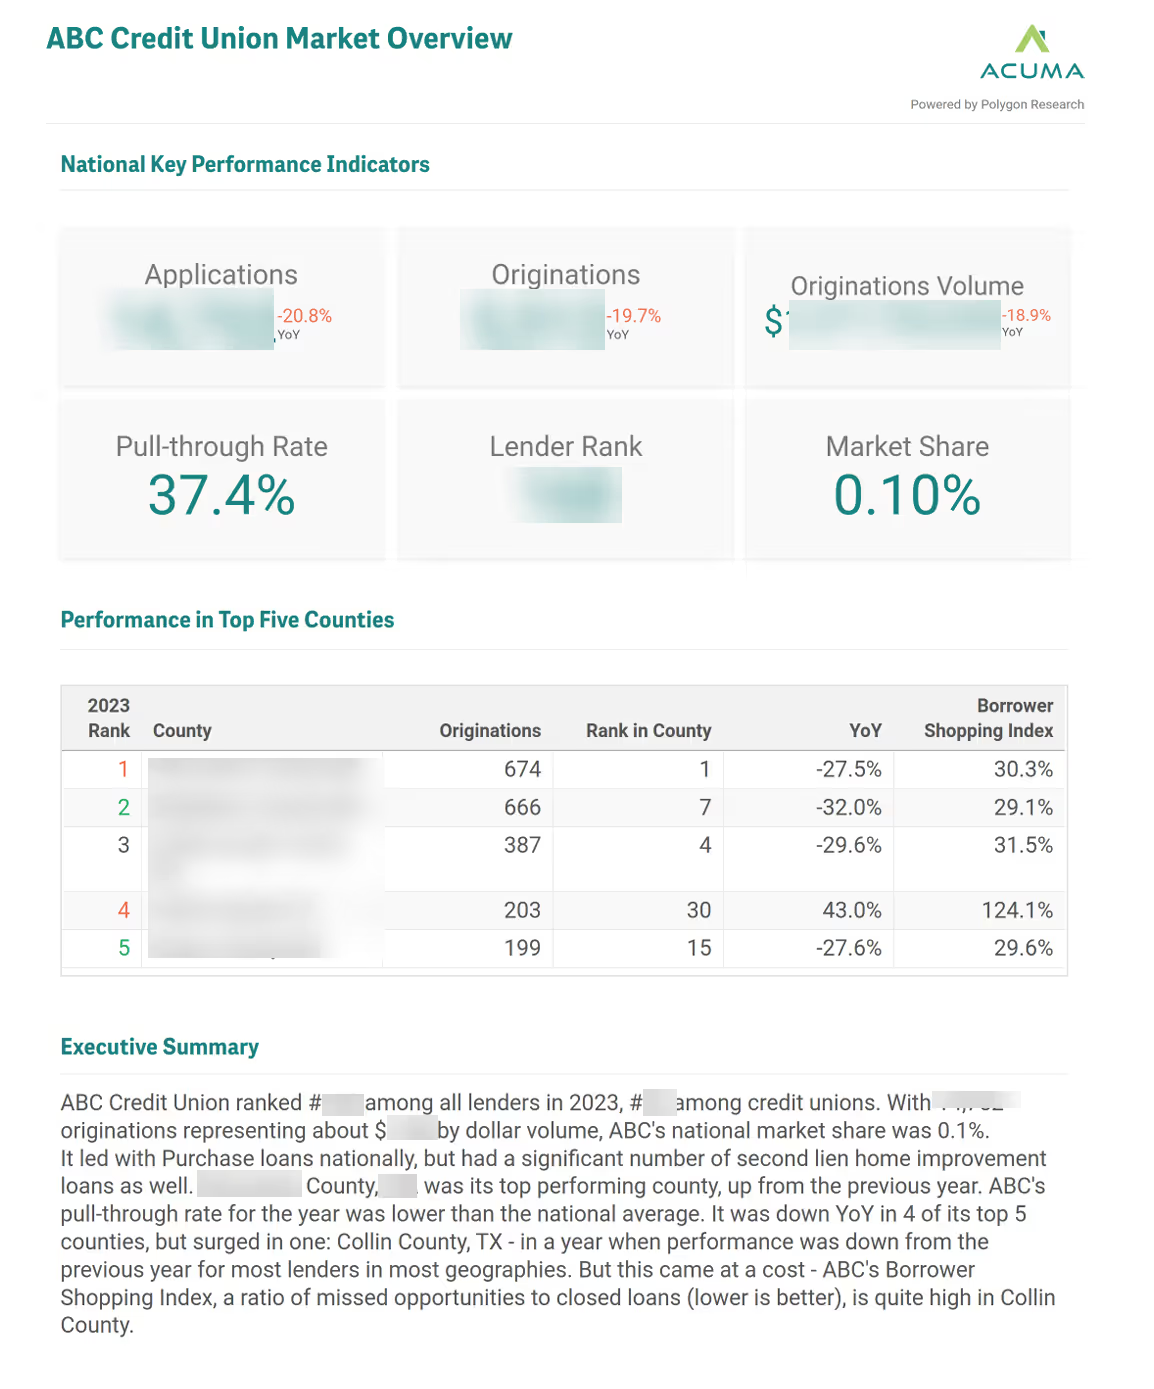
A credible benchmark starts with comparable evidence.
Same scopeAligned geography, period and loan population.
Visible source and vintageThe evidence stays beside the finding.
Documented definitionsFilters and methodology are explicit.
PROOF IN PRACTICE
See what meaningful benchmarking looks like.
Move beyond a leaderboard to understand the products, borrowers and markets behind lender performance.

What Is Peer Benchmarking?
A practical guide to building a fair comparison group and reading the differences with HMDA data.
Watch now →
Use Market Share to Drive Growth
See how unit and dollar share answer different questions—and where a lender is gaining or losing ground.
Read the analysis →
Analyze a Lender’s Non-QM Business
A loan-level example of looking past rank to understand product mix, geography and competitive position.
See the example →Common questions
What the analysis can and cannot tell you.
How should peers be selected?
Use legitimate business similarities such as geography, charter, size, channel, product mix or strategy. State the criteria so readers can judge the comparison.
Can public data explain every performance difference?
No. Public data can reveal patterns and generate better questions. Internal operations, pricing decisions, staffing and credit policy may explain differences that public records cannot observe.
Can the same benchmark support fair lending review?
Yes, with appropriate controls and methodology. Market benchmarking can complement internal monitoring, but it is not a substitute for legal or compliance review.
YOUR NEXT COMPETITIVE MOVE
See where you lead. Know where to move next.
Benchmark your institution against the right peers, isolate the difference and turn it into a decision your team can defend.
