Conventional Loans With Less Than 5% Down by State

Mortgage Markets
Loan Pricing
U.S. map with Conventional Loans With Less Than 5% Down by State by Polygon Research.
Chart Download and Page Share

Share or Download

Data Points
NE 18%, MO 16%, IN 16%, IA 15%, KS 15%, OH 15%, MI 15%, MN 15%, ND 14%, KY 14%, MD 14%, SD 14%, WV 14%, WI 13%, GA 12%, PA 12%, IL 11%, LA 11%, NM 11%, AK 10%, AR 10%, DE 10%, MS 10%, OK 10%, AL 9%, CT 9%, TX 9%, UT 9%, VA 9%, AZ 8%, CO 8%, ME 8%, NC 8%, NH 8%, NV 8%, TN 8%, VT 8%, WA 8%, DC 7%, FL 7%, ID 7%, NY 7%, OR 7%, SC 7%, CA 6%, HI 6%, MT 6%, WY 6%, MA 5%, RI 5%, NJ 4%, GU 23%
Date Published:
June 12, 2026
Date Updated:
June 12, 2026
Chart type:
Map
Suggested Citation:
Polygon Research, "Conventional Loans With Less Than 5% Down by State," MBS Pivot (Polygon Pulse), accessed June 2026, polygonresearch.com/data/conventional-loans-less-than-5-percent-down-by-state.
Key Insight and Commentary

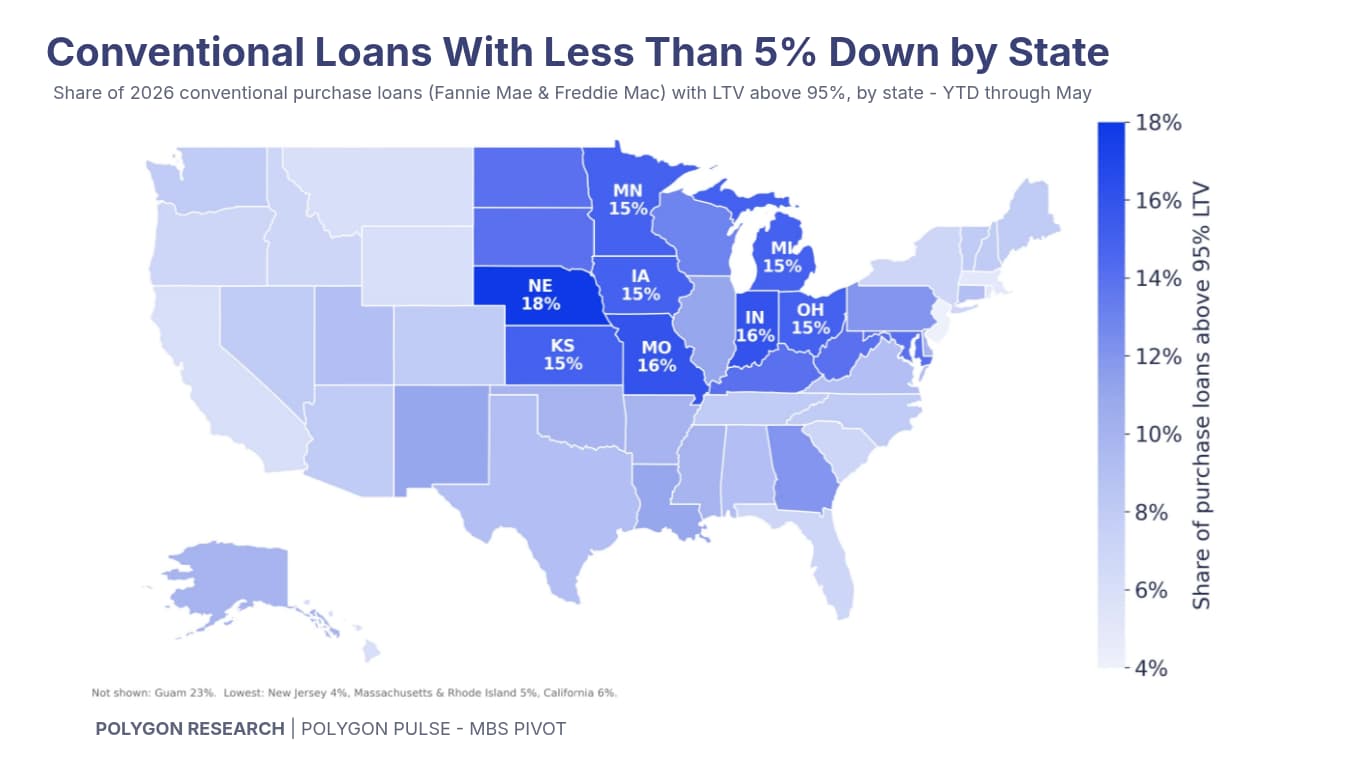
In 2026, the highest shares of conventional purchase loans above 95% LTV are in the Midwest: Nebraska (18%), Missouri (16%), Indiana (16%), and a block at 15% across Iowa, Kansas, Ohio, Michigan, and Minnesota. The lowest are on the coasts: New Jersey (4%), Massachusetts and Rhode Island (5%), and California and Hawaii (6%). Mississippi, where 61% of all agency purchase loans exceed 95% LTV, registers 10% on conventional loans alone.

These figures cover conventional loans only — every 2026 purchase loan in Fannie Mae and Freddie Mac mortgage-backed securities, year to date through May, excluding government loans (FHA, VA, USDA). Conventional loans allow down payments as low as 3% through Fannie Mae's HomeReady and Standard 97 programs and Freddie Mac's Home Possible and HomeOne, and they permit down payment assistance behind the first mortgage.

LTV is one dimension of the credit box: credit score, DTI, pricing, channel, and program mix vary by state and lender behind these figures, all available at loan level in MBS Pivot. For the full market view including government lending, see Where Homebuyers Put Less Than 5% Down. Updated monthly as new agency disclosure data is released.

From Analysis to Action

This analysis provides a clear blueprint for how to uncover meaningful market dynamics. Its true power is unleashed when you apply this same methodology to your own local markets. Because all real estate is local, this granular approach is essential for crafting precise strategies that effectively address the unique conditions of each community.

Ready to Continue? Get Your Exact Market Answers.

Go beyond generic insights. Polygon's interactive tools and limitless filtering empower you to tailor market data to your specific strategy.
Start your 7-day free trial.
Unlock My Custom Insights Now - Free Trial