California
Self-employed and investors
California
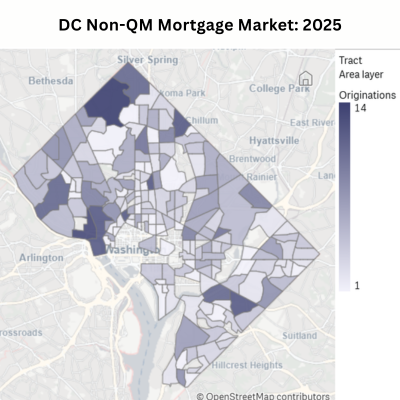
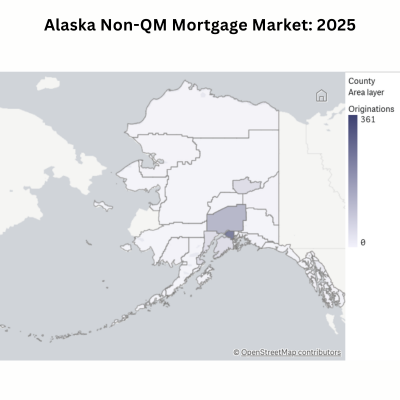
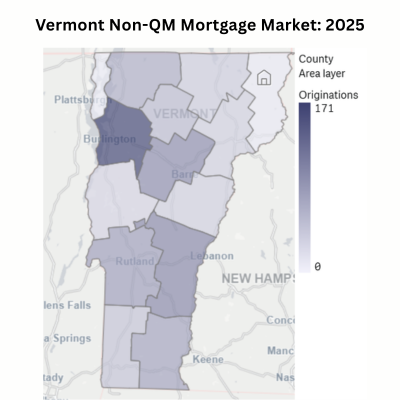
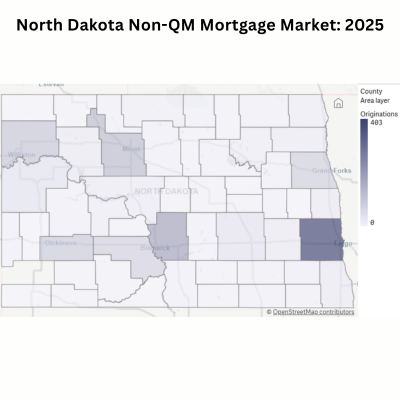
Count of Non-QM loans
California
Non-QM lending growth
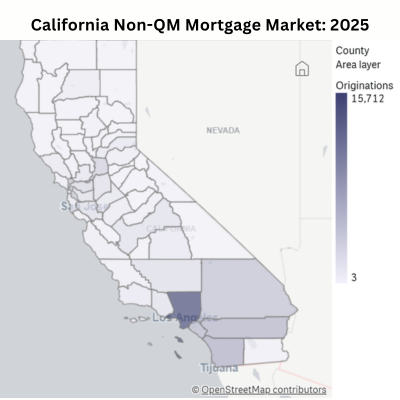
California is the largest Non-QM lending market in the United States. In 2025, lenders originated 72,547 Non-QM loans, representing roughly 10% of national Non-QM originations and a 28.5% increase year over year. Non-QM lending activity in California is concentrated in major housing markets, with the Los Angeles, Riverside, and San Francisco metropolitan areas generating the highest volumes of originations. These markets combine high home prices, a large self-employed workforce, and strong investor activity, all of which contribute to sustained demand for alternative mortgage products.
Polygon Vision estimates that California presents a Total Addressable Market (TAM) of approximately 998,533 potential Non-QM borrowers. This opportunity is comprised of 526,268 self-employed households and 472,265 small real estate investors. These segments often struggle with traditional 'box' underwriting due to non-standard income documentation or complex asset structures. With self-employed professionals making up a significant portion of the workforce, the demand for bank-statement and P&L-based programs is substantial. Furthermore, the presence of 472,265 investors highlights a massive need for Debt Service Coverage Ratio (DSCR) lending products. Bridging the gap between this vast potential and current origination levels represents a primary growth lever for Non-QM specialists in California.
This figure reflects Polygon Research’s estimate of the total addressable Non-QM market in this state. It combines modeled counts of self-employed households with mortgage-relevant income and small real estate investors using ACS microdata processed through CensusVision. How we size the Non-QM market
Polygon Research calculates that Non-QM loans represented 10.2% of total U.S. mortgage originations in 2025 by loan count and 10% by dollar volume, totaling over $239 billion across 697,605 loans. This is based on loan-level HMDA data classified using the ATR/QM regulatory framework. This market size analysis is based on Polygon Research's methodology described in a recent whitepaper. You can download it here to learn more: https://www.polygonresearch.com/whitepapers/unlocking-non-qm-market-intelligence
Non-QM analysis is part of Polygon Vision. The Professional plan is $199 per month, or $1,992 per year, which works out to $166 per month with two months free. Executive and Enterprise plans are set up personally by our team. You can also explore the same governed data free on mortgagedata.ai, which has a forever-free tier with no credit card required, plus a $79 per month Essentials plan. Full details at https://www.polygonresearch.com/pricing
Non-QM loans include mortgages that do not meet Qualified Mortgage standards due to factors such as alternative income documentation (bank statement loans), debt service coverage ratio underwriting (DSCR loans for investors), interest-only payment structures, pricing above QM thresholds, or sale to private securitizers rather than government-sponsored enterprises. For analytical purposes, Polygon Research also flags business-purpose and DSCR loans separately within the Non-QM category. Download the full methodology: https://www.polygonresearch.com/whitepapers/unlocking-non-qm-market-intelligence
Start free on mortgagedata.ai, which has a forever-free tier — 3 answers a day and 15 a month, with no credit card required. For the full Polygon Vision suite, ask us for a guided 7-day trial and our team will set you up personally. See all plans at https://www.polygonresearch.com/pricing
Yes. Polygon Vision provides loan-level Non-QM analysis filterable by state, metropolitan area, county, and census tract. Data includes origination volume, top lenders, borrower profiles, pricing, and year-over-year growth trends. Free state-level reports are available on this page, and you can explore the underlying data free on mortgagedata.ai, which has a forever-free tier with no credit card required.
Each HMDA loan record from 2018 through 2025 is evaluated against year-specific Ability-to-Repay and Qualified Mortgage standards from 12 CFR §1026.43. Classification is based on observable loan characteristics including pricing thresholds, product features, fee structures, and purchaser type. The full methodology is publicly documented: https://www.polygonresearch.com/whitepapers/unlocking-non-qm-market-intelligence
Most industry estimates rely on securitization data, inferred flags from known Non-QM lender names, samples, or lock activity. Polygon analyzes all funded HMDA loans, including portfolio lending, providing a more complete and transparent view of the Non-QM market. Read our methodology: https://www.polygonresearch.com/whitepapers/unlocking-non-qm-market-intelligence
Yes. For analytical purposes, business-purpose and DSCR loans are incorporated into the Non-QM category and flagged separately, even though ATR/QM rules do not govern business-purpose credit. Learn more in our methodology whitepaper.
Yes. Polygon's Non-QM classification is fully transparent and built on specific, loan-level reason codes (pricing, fees, product features, purchaser type, and more). Users can filter and adjust these factors to focus only on regulatory features or build a custom definition aligned with their strategy, risk, or compliance needs. Download the methodology to learn more: https://www.polygonresearch.com/whitepapers/unlocking-non-qm-market-intelligence
No. Polygon Research's Non-QM designation is a Regulation Z informed analytic classification designed for market intelligence, benchmarking, and strategy. It is not a substitute for lender-side legal or compliance determinations. To learn more, download the methodology: https://www.polygonresearch.com/whitepapers/unlocking-non-qm-market-intelligence