New York
Self-employed and investors
New York
Count of Non-QM loans
New York
Non-QM lending growth
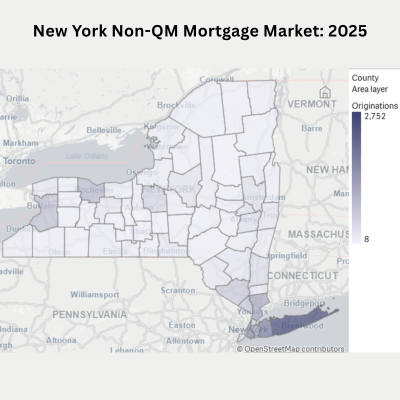
New York is currently ranked as the number 13 market for Non-QM lending in the United States. With 19,066 Non-QM loans originated in the recent period, the state has experienced a significant growth rate of 27.23% year-over-year. The estimated potential borrower pool in New York stands at 302,164, indicating a deep market for alternative financing solutions. Market activity is heavily centered around major hubs, specifically New York-Newark-Jersey City, NY-NJ, Rochester, NY, and Buffalo-Cheektowaga, NY. Leading the charge in loan originations are top-tier lenders including ROCKET MORTGAGE, LLC, JPMORGAN CHASE BANK, NATIONAL ASSOCIATION, and CITIZENS BANK, NATIONAL ASSOCIATION. The combination of high borrower potential and robust growth metrics positions New York as a vital corridor for Non-QM market expansion. This environment is particularly conducive to self-employed professionals and real estate investors who require flexible underwriting standards. As national trends shift toward specialized mortgage products, New York continues to demonstrate strong resilience and upward momentum in the alternative lending sector.
Polygon Vision estimates that New York presents a Total Addressable Market (TAM) of approximately 277,687 potential Non-QM borrowers. This opportunity is comprised of 145,231 self-employed households and 132,456 small real estate investors. These segments often struggle with traditional 'box' underwriting due to non-standard income documentation or complex asset structures. With self-employed professionals making up a significant portion of the workforce, the demand for bank-statement and P&L-based programs is substantial. Furthermore, the presence of 132,456 investors highlights a massive need for Debt Service Coverage Ratio (DSCR) lending products. Bridging the gap between this vast potential and current origination levels represents a primary growth lever for Non-QM specialists in New York.
This figure reflects Polygon Research’s estimate of the total addressable Non-QM market in this state. It combines modeled counts of self-employed households with mortgage-relevant income and small real estate investors using ACS microdata processed through CensusVision. How we size the Non-QM market
Polygon Research calculates that Non-QM loans represented 10.2% of total U.S. mortgage originations in 2025 by loan count and 10% by dollar volume, totaling over $239 billion across 697,605 loans. This is based on loan-level HMDA data classified using the ATR/QM regulatory framework. This market size analysis is based on Polygon Research's methodology described in a recent whitepaper. You can download it here to learn more: https://www.polygonresearch.com/whitepapers/unlocking-non-qm-market-intelligence
We believe in fully transparent pricing—no hidden fees and no "call us for a quote" barriers. We offer three distinct subscription tiers to scale with your team's data needs: Starter, Pro, and Premium. Pricing starts at just $130/month (billed annually). You can view all of our pricing tiers and a full feature breakdown on our www.polygonresearch.com/pricing to find the perfect fit.
Non-QM loans include mortgages that do not meet Qualified Mortgage standards due to factors such as alternative income documentation (bank statement loans), debt service coverage ratio underwriting (DSCR loans for investors), interest-only payment structures, pricing above QM thresholds, or sale to private securitizers rather than government-sponsored enterprises. For analytical purposes, Polygon Research also flags business-purpose and DSCR loans separately within the Non-QM category. Download the full methodology: https://www.polygonresearch.com/whitepapers/unlocking-non-qm-market-intelligence
You can start immediately with a 7-day free trial to get hands-on experience with the data before making any commitments. A credit card is required to register, but you will have full access to explore Polygon Vision's contextual analysis and Non-QM market insights during your trial. Start your free trial here: www.polygonresearch.com/pricing
Yes. Polygon Vision provides loan-level Non-QM analysis filterable by state, metropolitan area, county, and census tract. Data includes origination volume, top lenders, borrower profiles, pricing, and year-over-year growth trends. Free state-level reports are available on this page, and full interactive data is accessible through a 7-day free trial.
Each HMDA loan record from 2018 through 2025 is evaluated against year-specific Ability-to-Repay and Qualified Mortgage standards from 12 CFR §1026.43. Classification is based on observable loan characteristics including pricing thresholds, product features, fee structures, and purchaser type. The full methodology is publicly documented: https://www.polygonresearch.com/whitepapers/unlocking-non-qm-market-intelligence
Most industry estimates rely on securitization data, inferred flags from known Non-QM lender names, samples, or lock activity. Polygon analyzes all funded HMDA loans, including portfolio lending, providing a more complete and transparent view of the Non-QM market. Read our methodology: https://www.polygonresearch.com/whitepapers/unlocking-non-qm-market-intelligence
Yes. For analytical purposes, business-purpose and DSCR loans are incorporated into the Non-QM category and flagged separately, even though ATR/QM rules do not govern business-purpose credit. Learn more in our methodology whitepaper.
Yes. Polygon's Non-QM classification is fully transparent and built on specific, loan-level reason codes (pricing, fees, product features, purchaser type, and more). Users can filter and adjust these factors to focus only on regulatory features or build a custom definition aligned with their strategy, risk, or compliance needs. Download the methodology to learn more: https://www.polygonresearch.com/whitepapers/unlocking-non-qm-market-intelligence
No. Polygon Research's Non-QM designation is a Regulation Z informed analytic classification designed for market intelligence, benchmarking, and strategy. It is not a substitute for lender-side legal or compliance determinations. To learn more, download the methodology: https://www.polygonresearch.com/whitepapers/unlocking-non-qm-market-intelligence