Articles
5 minutes

How to Analyze a Lender’s Non-QM Business
July 24, 2026
Updated on:
July 23, 2026
Thumbnail of blog how to analyze non-qm lenders
Author:
Val Buresch, CMB

Five questions for turning fragmented Non-QM data into useful lender intelligence.

Detailed Non-QM lender intelligence is difficult to access. There is no single public source that shows the full market, and HMDA does not identify a loan as QM or Non-QM.

The available sources usually show only part of the picture. RMBS disclosures cover securitized pools but leave out loans retained in portfolio. Aggregate estimates help describe the market at a high level but often lack the lender, product and geographic detail needed for competitive analysis. Definitions can also vary from one source to another.

For whole-loan buyers, lenders and their advisors, that makes a basic question surprisingly hard to answer: What does a particular institution’s Non-QM business actually look like?

A practical way to see the business

The solution begins with a consistent loan-level method. By evaluating the characteristics reported under HMDA against a common analytical framework, Non-QM activity can be studied across lenders, including both loans reported as sold and loans retained in portfolio.

A lender ranking is then a useful starting point. It shows which institutions originated the most estimated loans or dollar volume. The next step is to understand the business behind the number.

Two lenders can produce similar Non-QM volume while operating very differently. One may concentrate on a few investor-heavy markets. Another may have a broad footprint, a larger consumer-purpose business or a different pattern of loan sales.

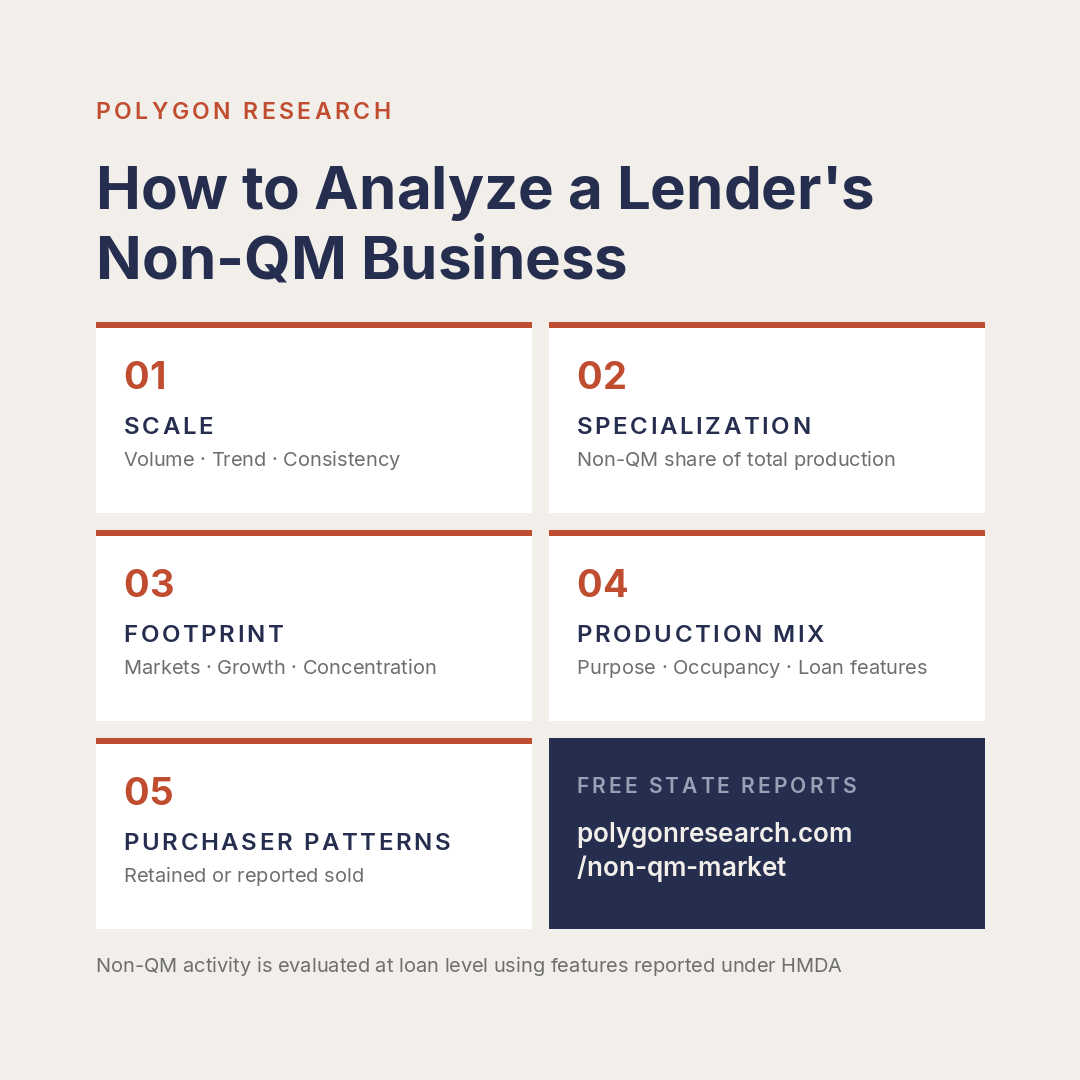
Five questions make that comparison more useful.
1. Start with scale

How large is the lender’s Non-QM business, and how consistent has it been?

Begin with estimated loan count and dollar volume. Then compare the lender’s market share and year-over-year trend.

The direction matters as much as the current rank. A lender can increase its Non-QM volume and still lose share if the broader market grows faster. A sudden increase may point to a channel expansion, acquisition or shift in product strategy. Consistent production over several years suggests a more established presence.

Start with:

  • Estimated Non-QM loan count and dollar volume
  • Share of the Non-QM market
  • Change from year to year
  • Consistency across multiple years

2. Measure specialization

What share of the lender’s total production is Non-QM?

High Non-QM volume can represent a lender’s core business or a smaller channel inside a much larger operation. Compare estimated Non-QM originations with the lender’s total mortgage production to see how specialized the institution is.

This distinction also improves peer selection. A national diversified lender and a focused Non-QM lender may appear close in a volume ranking while operating with very different business models. Comparing lenders with similar levels of specialization produces a more useful benchmark.

3. Map the footprint

Where is the lender actively competing?

National totals can conceal a highly concentrated strategy. Break the lender’s production down by state, metropolitan area, county and, where useful, census tract or zip code.

Look for:

  • Markets producing the largest share of the lender’s volume
  • Local markets where production is gaining or losing ground
  • Geographic overlap with your institution or target markets
  • Concentrations that may deserve closer review

Geographic patterns illuminate where a lender has developed strong broker, correspondent or referral relationships. Treat those patterns as questions for further investigation rather than conclusions about the lender’s strategy.

4. Study the production mix

What types of loans is the lender originating?

Compare loan purpose, occupancy, loan amount, lien status, property characteristics and disclosed loan features. This is where lenders with similar total volume begin to look very different.

One lender may be concentrated in investor-property purchase loans. Another may carry a larger share of balloon payment loans, or a very different loan size distribution. Tracked across years, the mix also shows the direction a business is moving.

Product labels are the one place this gets misleading. The industry markets in terms like bank statement and DSCR, and HMDA reports neither. The characteristics underneath those labels are disclosed, though. Business or commercial purpose is reported, along with occupancy, lien position, loan term, and whether a loan carries a balloon payment, interest-only period or negative amortization. Applied consistently at loan level, those fields give you a defensible picture of what a lender originates.

5. Review purchaser patterns

Are the loans retained or reported as sold?

HMDA reports broad purchaser categories, including portfolio retention, private securitizers, affiliate institutions and other purchasers. Together they show how a lender's production is distributed after origination.

Interpret each category against the type of institution reporting it. This matters most for "other purchaser," which aggregates materially different counterparties. For an independent mortgage bank, it commonly signals private capital executing outside agency channels. For a bank or credit union, the same category can include a Federal Home Loan Bank or a similar liquidity provider.

We account for that directly. Polygon Research applies lender-type-specific logic: for independent mortgage banks, an "other purchaser" execution is treated as Non-QM. For banks and credit unions it is not, so those loans are flagged only when another disclosed characteristic triggers the classification.

Put the five views together

The strongest analysis holds geography, time period and Non-QM methodology constant across every lender in the comparison.

A practical workflow:

  1. Define the market.
  2. Size each lender's Non-QM volume and its trend.
  3. Measure Non-QM as a share of that lender's total production.
  4. Map geographic concentration and where volume is moving.
  5. Compare production mix.
  6. Review reported purchaser patterns.
  7. Repeat across years and watch what changes.

In this way, the five views let you benchmark competitors, evaluate a new market or product, and identify institutions worth approaching for a whole-loan acquisition strategy.

Why the Non-QM methodology matters

HMDA includes no explicit Qualified Mortgage or Non-QM designation. Using all loans sold to private securitizers as a proxy misses loans retained in portfolio. Assigning every loan from a known Non-QM lender to the segment creates a different problem: many of those institutions also originate loans that meet QM standards.

Polygon Research addresses this at the loan level. Each reported origination is evaluated against the year-specific Ability-to-Repay and Qualified Mortgage framework in Regulation Z §1026.43, using observable fields such as pricing, points and fees, product features, purchaser type and business-purpose indicators.

The methodology is conservative where public data is unavailable or privacy-modified. It is designed for market intelligence, benchmarking and strategy. It should not be treated as a legal or compliance determination for an individual loan.

The full assumptions, regulatory framework and limitations are documented in Polygon Research’s Non-QM market intelligence methodology.

For a broader market-level framework, read How to Analyze the Non-QM Market with Loan-Level Data

Explore Non-QM lender intelligence

Polygon Research provides free state-level Non-QM market reports with estimated market size, leading lenders and local patterns.

HMDAVision turns difficult-to-access public data into an interactive loan-level view of the reported market. Users can compare lenders, geographies, borrower and property characteristics, loan features and purchaser patterns using one consistent analytical framework.

Articles
Val Buresch, CMB
5 minutes

How to Analyze a Lender’s Non-QM Business

Published
July 23, 2026
Updated
July 23, 2026

Detailed Non-QM lender data is difficult to access and compare. Learn how loan-level analysis reveals the business behind a lender ranking.

Thumbnail of blog how to analyze non-qm lenders

Five questions for turning fragmented Non-QM data into useful lender intelligence.

Detailed Non-QM lender intelligence is difficult to access. There is no single public source that shows the full market, and HMDA does not identify a loan as QM or Non-QM.

The available sources usually show only part of the picture. RMBS disclosures cover securitized pools but leave out loans retained in portfolio. Aggregate estimates help describe the market at a high level but often lack the lender, product and geographic detail needed for competitive analysis. Definitions can also vary from one source to another.

For whole-loan buyers, lenders and their advisors, that makes a basic question surprisingly hard to answer: What does a particular institution’s Non-QM business actually look like?

A practical way to see the business

The solution begins with a consistent loan-level method. By evaluating the characteristics reported under HMDA against a common analytical framework, Non-QM activity can be studied across lenders, including both loans reported as sold and loans retained in portfolio.

A lender ranking is then a useful starting point. It shows which institutions originated the most estimated loans or dollar volume. The next step is to understand the business behind the number.

Two lenders can produce similar Non-QM volume while operating very differently. One may concentrate on a few investor-heavy markets. Another may have a broad footprint, a larger consumer-purpose business or a different pattern of loan sales.

Five questions make that comparison more useful.

1. Start with scale

How large is the lender’s Non-QM business, and how consistent has it been?

Begin with estimated loan count and dollar volume. Then compare the lender’s market share and year-over-year trend.

The direction matters as much as the current rank. A lender can increase its Non-QM volume and still lose share if the broader market grows faster. A sudden increase may point to a channel expansion, acquisition or shift in product strategy. Consistent production over several years suggests a more established presence.

Start with:

  • Estimated Non-QM loan count and dollar volume
  • Share of the Non-QM market
  • Change from year to year
  • Consistency across multiple years

2. Measure specialization

What share of the lender’s total production is Non-QM?

High Non-QM volume can represent a lender’s core business or a smaller channel inside a much larger operation. Compare estimated Non-QM originations with the lender’s total mortgage production to see how specialized the institution is.

This distinction also improves peer selection. A national diversified lender and a focused Non-QM lender may appear close in a volume ranking while operating with very different business models. Comparing lenders with similar levels of specialization produces a more useful benchmark.

3. Map the footprint

Where is the lender actively competing?

National totals can conceal a highly concentrated strategy. Break the lender’s production down by state, metropolitan area, county and, where useful, census tract or zip code.

Look for:

  • Markets producing the largest share of the lender’s volume
  • Local markets where production is gaining or losing ground
  • Geographic overlap with your institution or target markets
  • Concentrations that may deserve closer review

Geographic patterns illuminate where a lender has developed strong broker, correspondent or referral relationships. Treat those patterns as questions for further investigation rather than conclusions about the lender’s strategy.

4. Study the production mix

What types of loans is the lender originating?

Compare loan purpose, occupancy, loan amount, lien status, property characteristics and disclosed loan features. This is where lenders with similar total volume begin to look very different.

One lender may be concentrated in investor-property purchase loans. Another may carry a larger share of balloon payment loans, or a very different loan size distribution. Tracked across years, the mix also shows the direction a business is moving.

Product labels are the one place this gets misleading. The industry markets in terms like bank statement and DSCR, and HMDA reports neither. The characteristics underneath those labels are disclosed, though. Business or commercial purpose is reported, along with occupancy, lien position, loan term, and whether a loan carries a balloon payment, interest-only period or negative amortization. Applied consistently at loan level, those fields give you a defensible picture of what a lender originates.

5. Review purchaser patterns

Are the loans retained or reported as sold?

HMDA reports broad purchaser categories, including portfolio retention, private securitizers, affiliate institutions and other purchasers. Together they show how a lender's production is distributed after origination.

Interpret each category against the type of institution reporting it. This matters most for "other purchaser," which aggregates materially different counterparties. For an independent mortgage bank, it commonly signals private capital executing outside agency channels. For a bank or credit union, the same category can include a Federal Home Loan Bank or a similar liquidity provider.

We account for that directly. Polygon Research applies lender-type-specific logic: for independent mortgage banks, an "other purchaser" execution is treated as Non-QM. For banks and credit unions it is not, so those loans are flagged only when another disclosed characteristic triggers the classification.

Put the five views together

The strongest analysis holds geography, time period and Non-QM methodology constant across every lender in the comparison.

A practical workflow:

  1. Define the market.
  2. Size each lender's Non-QM volume and its trend.
  3. Measure Non-QM as a share of that lender's total production.
  4. Map geographic concentration and where volume is moving.
  5. Compare production mix.
  6. Review reported purchaser patterns.
  7. Repeat across years and watch what changes.

In this way, the five views let you benchmark competitors, evaluate a new market or product, and identify institutions worth approaching for a whole-loan acquisition strategy.

Why the Non-QM methodology matters

HMDA includes no explicit Qualified Mortgage or Non-QM designation. Using all loans sold to private securitizers as a proxy misses loans retained in portfolio. Assigning every loan from a known Non-QM lender to the segment creates a different problem: many of those institutions also originate loans that meet QM standards.

Polygon Research addresses this at the loan level. Each reported origination is evaluated against the year-specific Ability-to-Repay and Qualified Mortgage framework in Regulation Z §1026.43, using observable fields such as pricing, points and fees, product features, purchaser type and business-purpose indicators.

The methodology is conservative where public data is unavailable or privacy-modified. It is designed for market intelligence, benchmarking and strategy. It should not be treated as a legal or compliance determination for an individual loan.

The full assumptions, regulatory framework and limitations are documented in Polygon Research’s Non-QM market intelligence methodology.

For a broader market-level framework, read How to Analyze the Non-QM Market with Loan-Level Data

Explore Non-QM lender intelligence

Polygon Research provides free state-level Non-QM market reports with estimated market size, leading lenders and local patterns.

HMDAVision turns difficult-to-access public data into an interactive loan-level view of the reported market. Users can compare lenders, geographies, borrower and property characteristics, loan features and purchaser patterns using one consistent analytical framework.

Frequently Asked Questions

Why is detailed Non-QM lender data difficult to access?

There is no single public source for the full Non-QM market. HMDA includes no explicit QM or Non-QM designation, RMBS disclosures cover only securitized pools, and aggregate estimates often provide limited lender or geographic detail.

Icon - Elements Webflow Library - BRIX Templates

What is the best way to compare lenders active in Non-QM?

Use the same geography, reporting period and classification method for every lender. Compare scale, Non-QM share of total production, geographic footprint, production mix and reported purchaser patterns.

Icon - Elements Webflow Library - BRIX Templates

Can purchaser type identify potential whole-loan sellers?

Purchaser type can show whether a lender’s loans were generally retained or reported as sold to broad purchaser categories. It can narrow the field for further research, but it does not show current availability, trade terms or the complete chain of ownership.

Icon - Elements Webflow Library - BRIX Templates

Is Polygon Research’s Non-QM classification a legal determination?

No. It is a Regulation Z-informed analytical classification developed for market intelligence, benchmarking and strategy. Lenders remain responsible for their own legal, compliance, credit and transaction-level review.

Icon - Elements Webflow Library - BRIX Templates

Explore Mortgage Market Intelligence in Practice

See how Polygon helps teams grow through insight.