Adjustable-Rate Mortgages Held in Portfolio

Origination Trends
Chart showing 89% of 2025 ARM originations were held in portfolio, compared with 26% of fixed-rate originations; agency purchasers accounted for 3.8%.
Chart Download and Page Share

Share or Download

Data Points
Report period | 2025 Source | Polygon Research — HMDAVision Source data | 2025 HMDA originations Headline | Nine in ten ARMs stay in portfolio Subheadline | In 2025, 89% of adjustable-rate originations stayed in portfolio, against 26% of fixed-rate loans KPI label | ARMs held in portfolio | 2025 KPI | 89% KPI description | Stayed on the originator’s balance sheet KPI loan count | 1.26M of 1.41M ARM originations Comparison metric | Share of originations kept in portfolio Comparison | ARMs | 89% Comparison | Fixed-rate | 26% Chart label | Where 2025 ARMs went Chart metric | Adjustable-rate originations by destination, share of all ARM loans Reported purchaser type | Held in portfolio | 89.0% | 1,258,894 loans Reported purchaser type | Banks, CUs & finance cos | 5.0% | 70,263 loans Reported purchaser type | Agencies — Fannie, Freddie, Ginnie | 3.8% | 54,428 loans Reported purchaser type | Other & affiliates | 1.5% | 21,535 loans Reported purchaser type | Private-label securitizers | 0.7% | 9,449 loans Definition | Held in portfolio | Loans not sold; HMDA “Portfolio” Definition | Agencies | Fannie Mae, Freddie Mac and Ginnie Mae Definition | Banks, CUs & finance cos | Commercial and savings banks plus credit union, mortgage and finance company purchasers Definition | Other & affiliates | Affiliate institutions, life insurers, Farmer Mac and other purchasers Chart note | Purchaser types relabeled for clarity
What share of ARM loans are held in portfolio?
In 2025, 89% of ARM originations were held in portfolio.
Date Published:
June 26, 2026
Date Updated:
June 26, 2026
Chart type:
Bar Chart
Suggested Citation:
Polygon Research, “2025 ARM Originations by HMDA Purchaser Type,” HMDAVision, updated June 2026. Data through 2025. Scope: 2025 HMDA originations; ARMs. Metric: loan count and share of originations by reported purchaser type; “Portfolio” means the loan was not sold. Accessed June 26, 2026.
Key insights

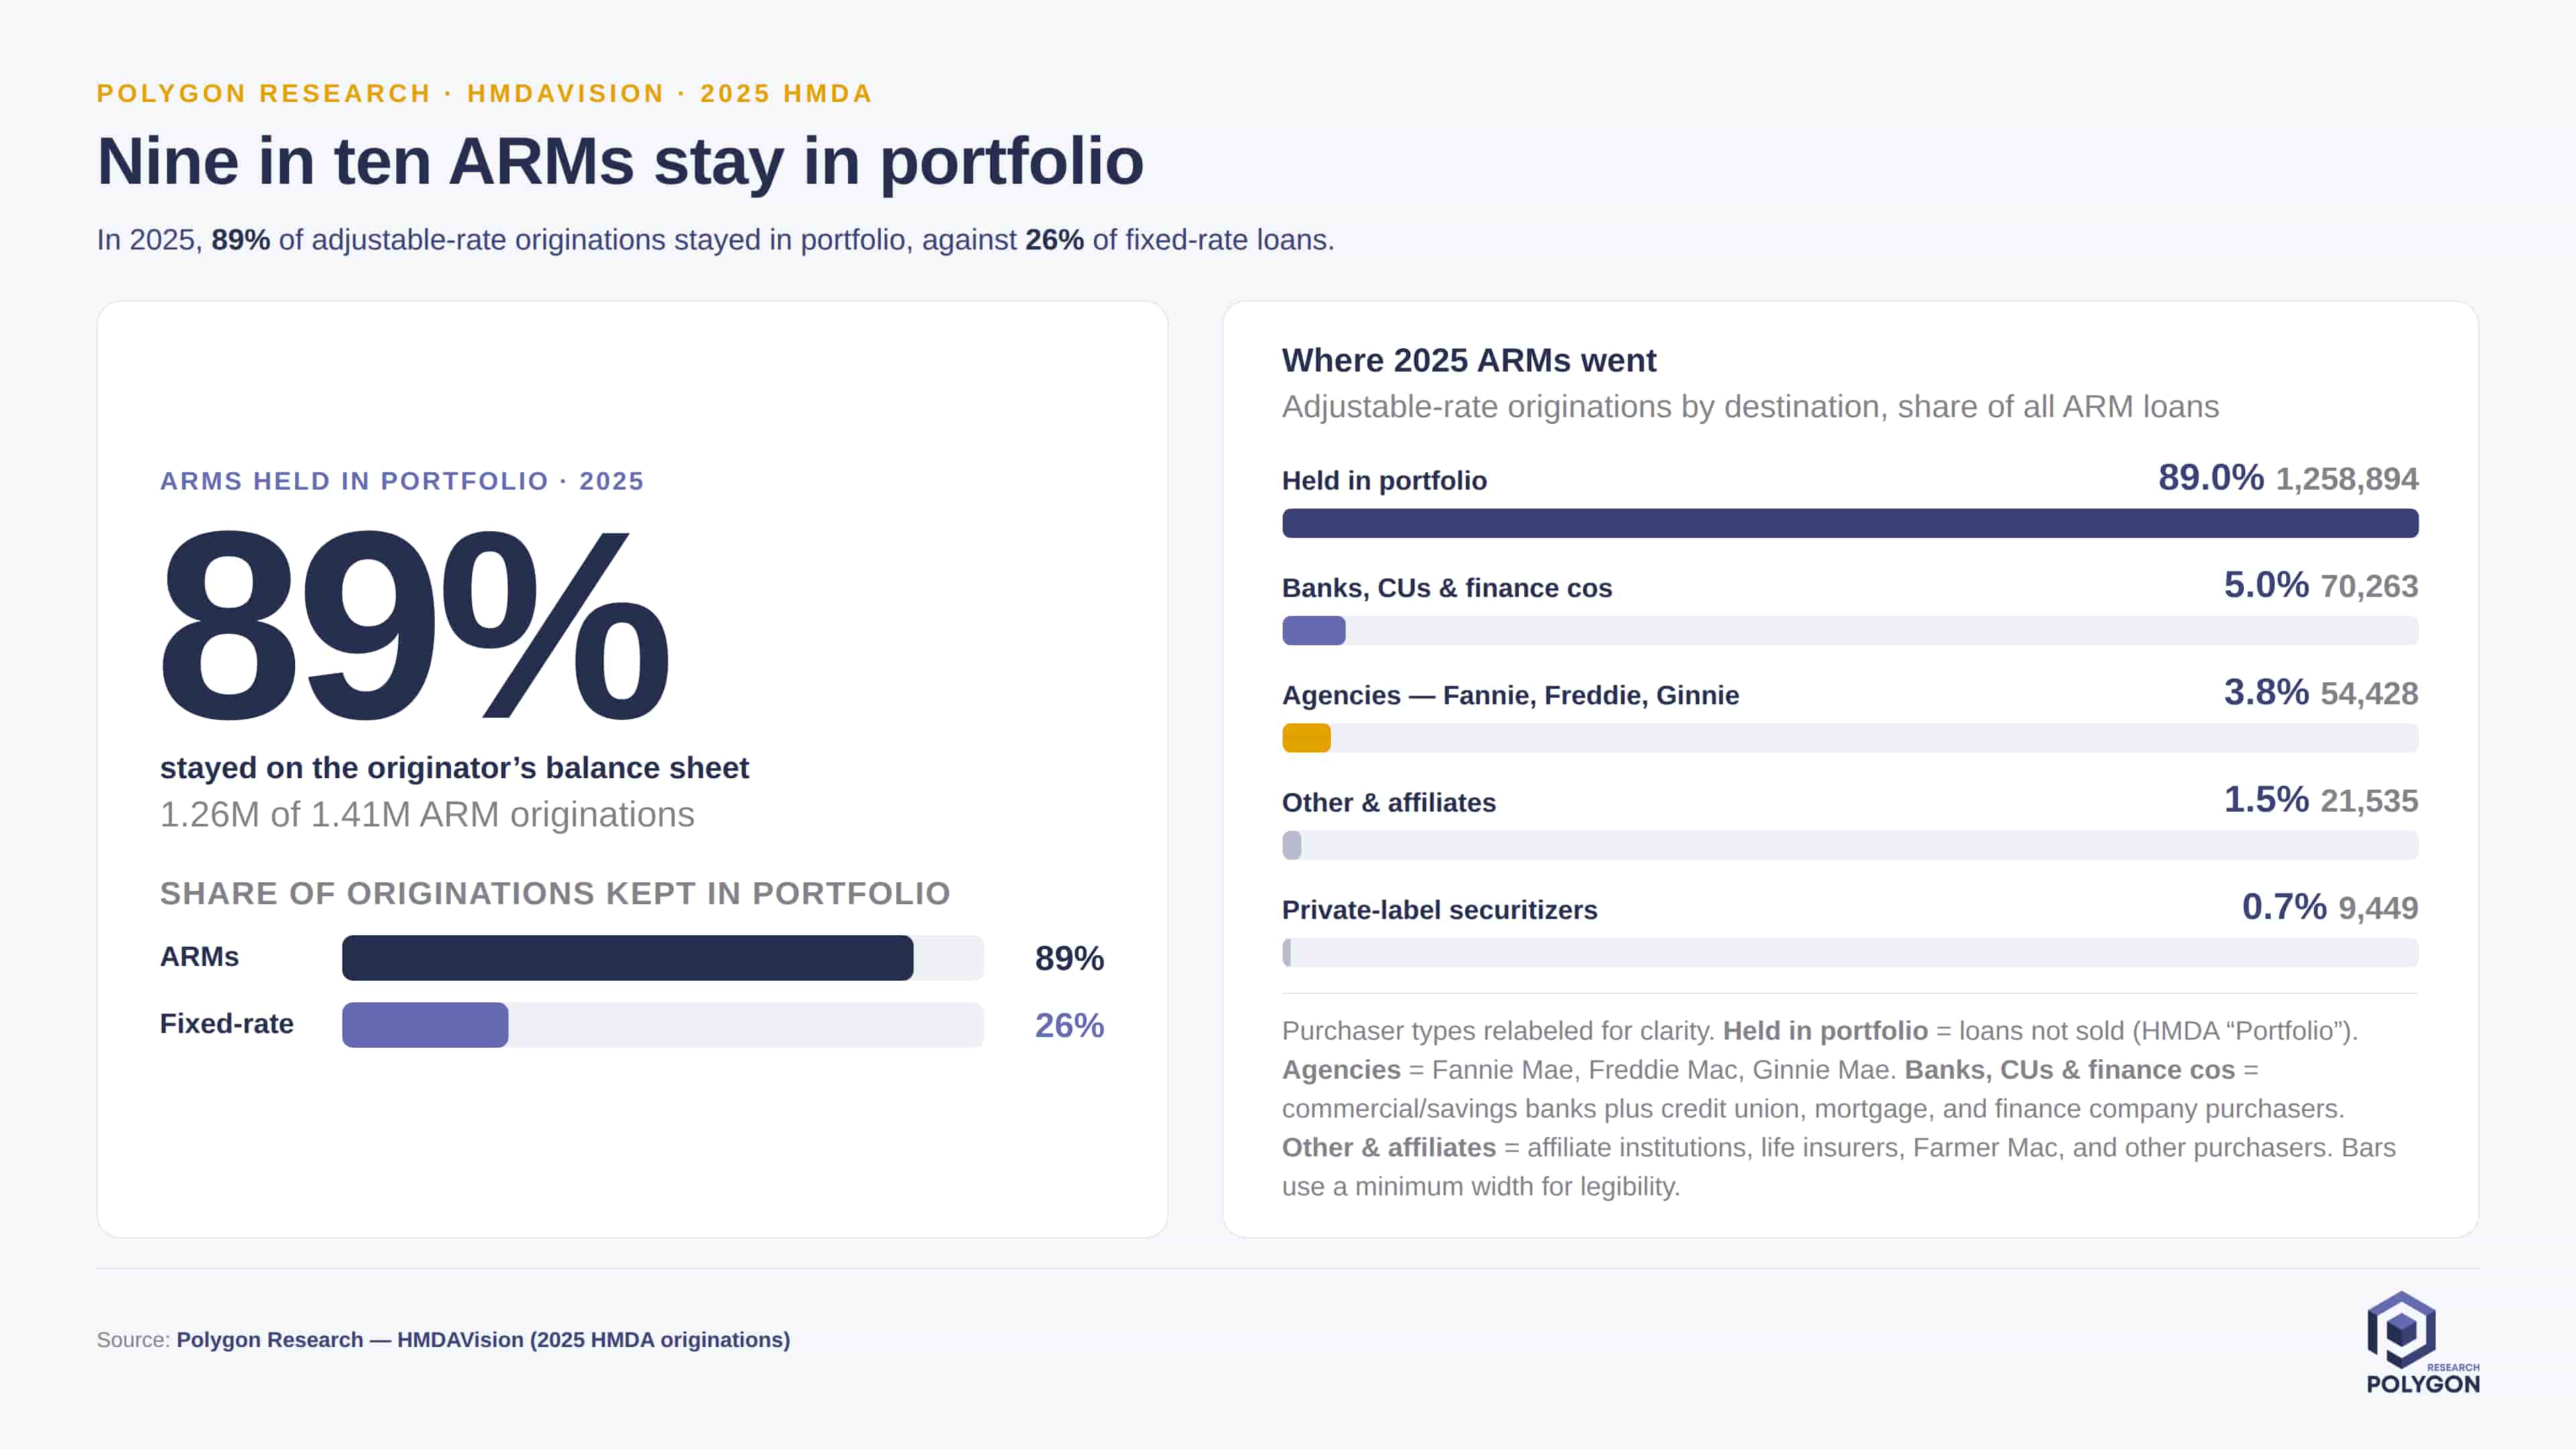
Among the 2025 HMDA originations shown, 89.0% of ARMs—1,258,894 loans—were reported as “Portfolio,” meaning the loans were not sold. By comparison, 26% of fixed-rate originations were held in portfolio.

Reported sales were dispersed across several purchaser groups. Banks, credit unions and finance companies acquired 5.0% of ARMs, or 70,263 loans. Fannie Mae, Freddie Mac and Ginnie Mae accounted for 3.8%, or 54,428 loans. Other purchasers and affiliates represented 1.5%, and private-label securitizers 0.7%.

For depositories, the 89% portfolio share provides a benchmark for ARM balance-sheet appetite, concentration and liquidity capacity. Polygon’s Agency ARM share, Agency ARM lender rankings and Agency ARM borrower credit profile provide broader context for the agency segment. Together, these views show how agency activity is changing, which seller/issuers are most active and how the borrower credit mix has shifted since 2021. Product, capital-markets and risk teams can use the combined picture to evaluate portfolio retention, agency eligibility and execution, pricing, funding capacity and layered-risk exposure.

HMDA purchaser type identifies whether and to whom a loan was sold; it does not explain why a loan was retained, whether it was sold later, or the economics of the execution. Purchaser groups were relabeled for clarity.

From Analysis to Action

This analysis provides a clear blueprint for how to uncover meaningful market dynamics. Its true power is unleashed when you apply this same methodology to your own local markets. Because all real estate is local, this granular approach is essential for crafting precise strategies that effectively address the unique conditions of each community.

Ready to Continue? Get Your Exact Market Answers.

Go beyond generic insights. Polygon's interactive tools and limitless filtering empower you to tailor market data to your specific strategy.
Start your 7-day free trial.
Unlock My Custom Insights Now - Free Trial