First-Time Buyer Fixed vs Adjustable Mortgage Rates
First-Time Homebuyer
Origination Trends
Loan Pricing
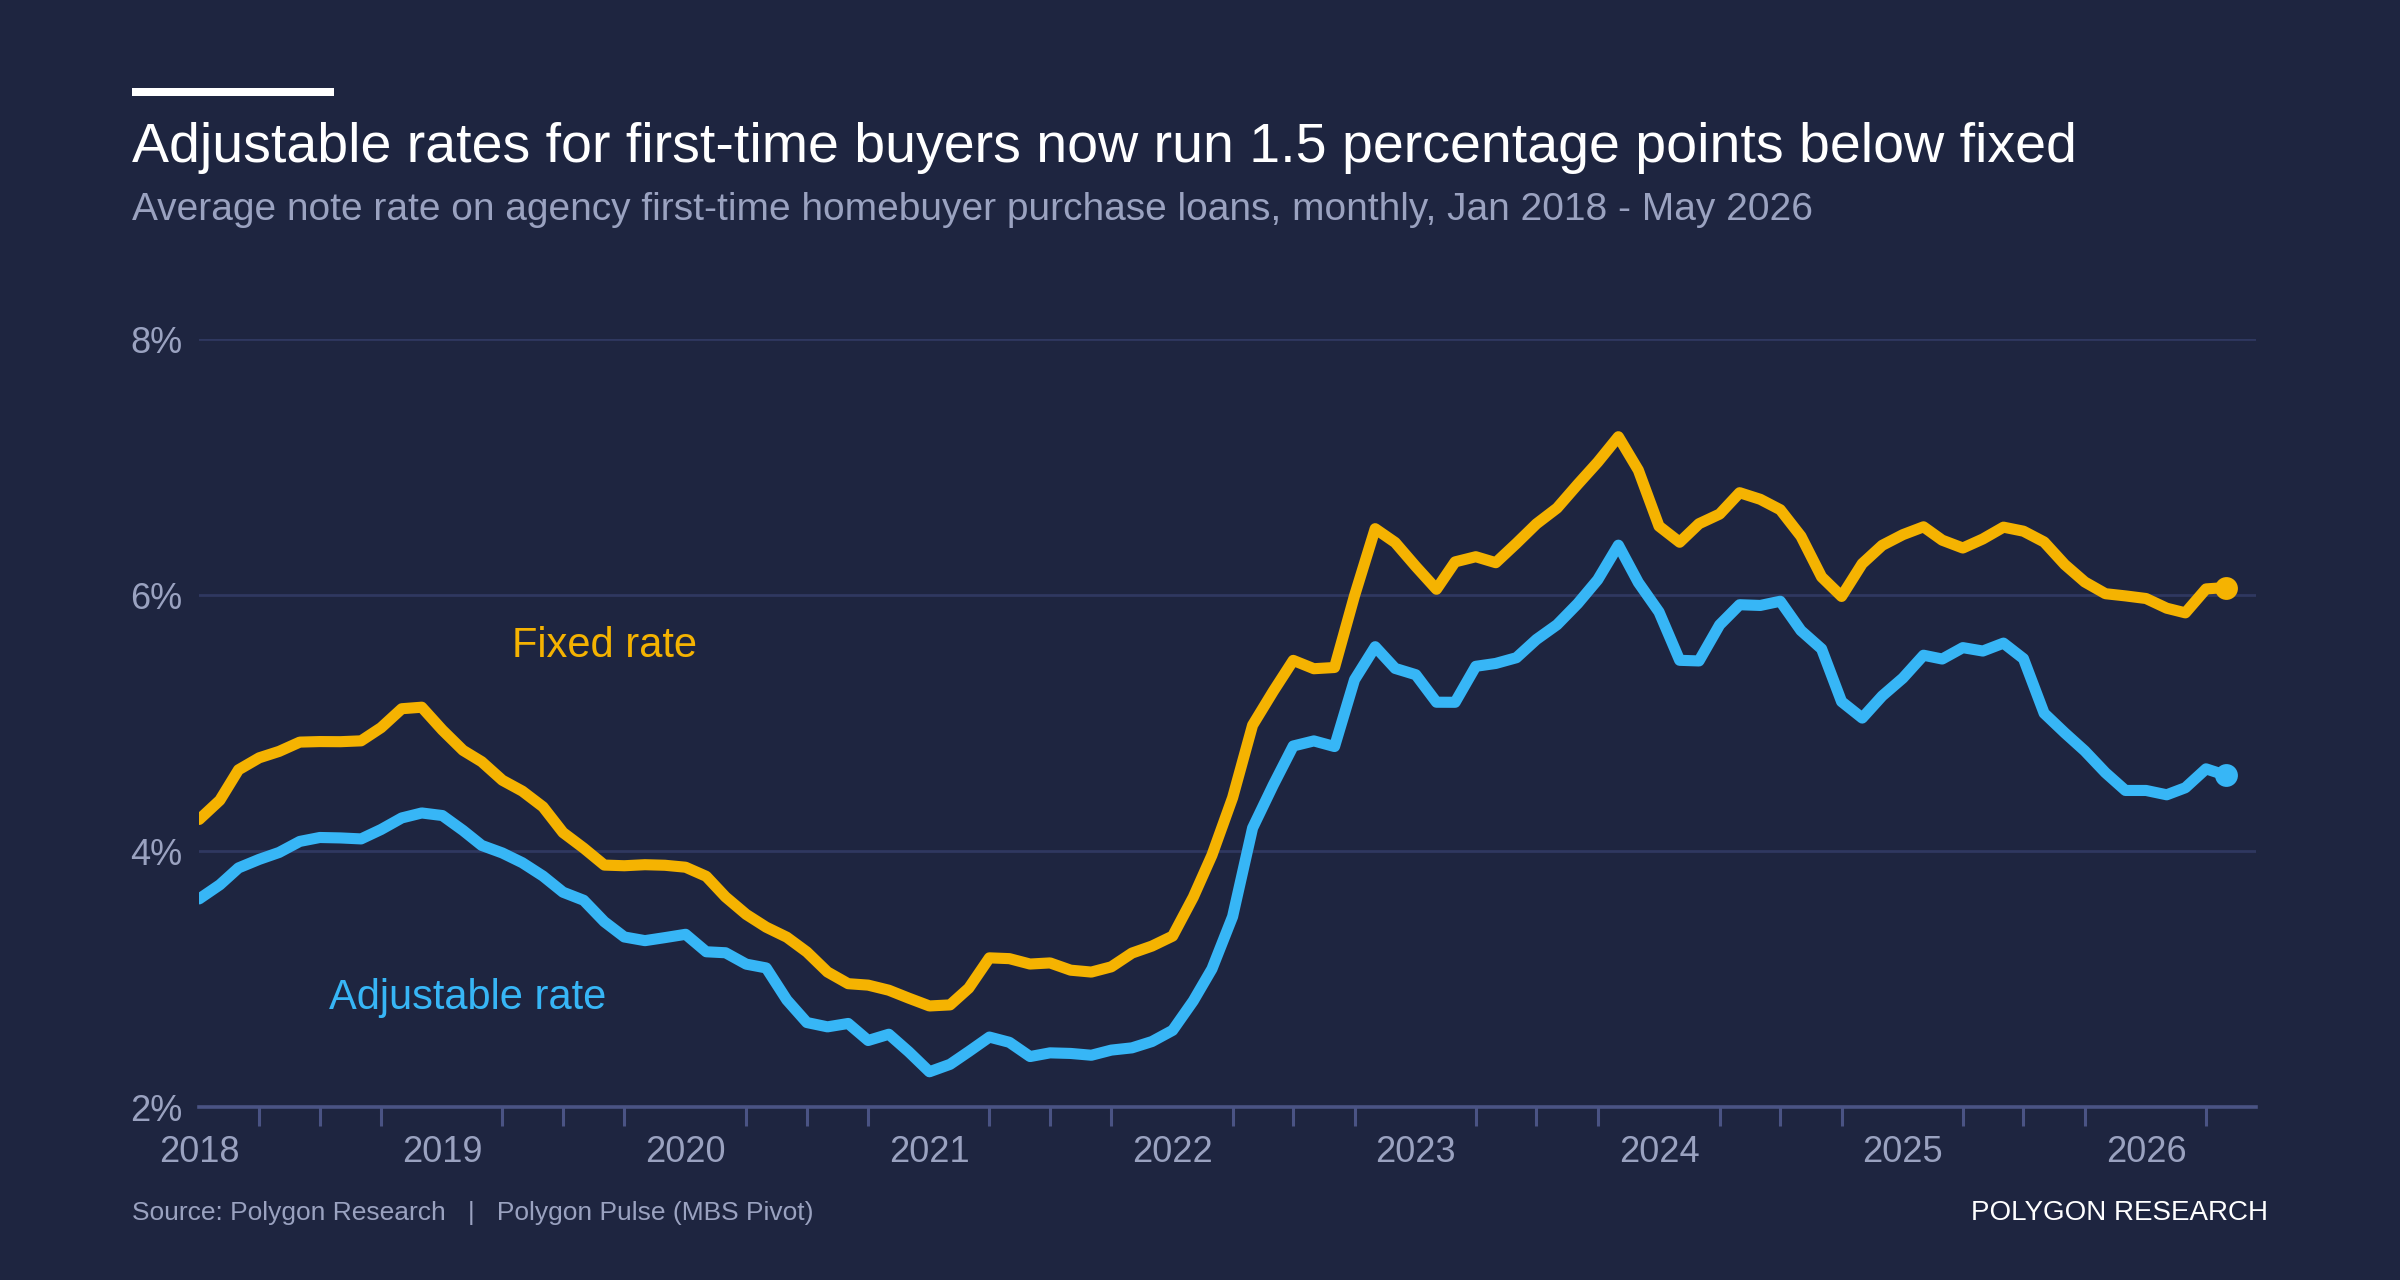
Line chart of average note rates on agency first-time homebuyer purchase loans, January 2018 to May 2026. The fixed and adjustable lines track closely until 2025, then separate to about 6.1% and 4.6%.
Chart Download and Page Share

Share or Download

Data Points
Reporting period | Jan 2018 to May 2026 | monthly Scope | Agency first-time homebuyer purchase originations Metric | Average note rate by product | Adjustable share of loan count May 2026 | Fixed 6.06% | Adjustable 4.59% | Difference 1.47 points Apr 2026 | Fixed 6.05% | Adjustable 4.64% | Difference 1.41 points Mar 2026 | Fixed 5.86% | Adjustable 4.50% | Difference 1.37 points Dec 2025 | Fixed 5.99% | Adjustable 4.47% | Difference 1.52 points | widest in series Aug 2025 | Fixed 6.42% | Adjustable 5.08% | Difference 1.34 points May 2025 | Fixed 6.44% | Adjustable 5.56% | Difference 0.88 points Average difference 2018 to 2024 | 0.70 points Average difference trailing 12 months | 1.33 points Widest difference in series | Dec 2025 | 1.52 points Adjustable share Jan to May 2024 | 0.45% | 2,599 of 578,908 loans Adjustable share Jan to May 2025 | 0.51% | 2,957 of 578,891 loans Adjustable share Jan to May 2026 | 2.48% | 14,076 of 568,248 loans Peak monthly adjustable share | Apr 2026 | 2.71% | 3,578 loans Total first-time buyer purchase loans Jan to May 2026 | 568,248 | -1.8% vs 2025 Fixed rate high in series | Nov 2023 | 7.24% Adjustable rate low in series | Jan 2021 | 2.28% Illustrative payment difference | $350,000 loan | 6.06% vs 4.59% | about $325 per month Note | This measures the difference between fixed and adjustable note rates | Not the HMDA rate spread field Excluded | Jun 2026 and Jul 2026 | incomplete reporting
Why are more first-time buyers choosing adjustable-rate mortgages?
Fixed-rate first-time buyer purchase loans averaged 6.06% in May 2026 while adjustable-rate loans averaged 4.59%, a difference of about 1.5 points. The adjustable share rose from 0.51% to 2.48% of loans year over year.
Date Published:
August 28, 2026
Date Updated:
August 28, 2026
Chart type:
Line Chart
Suggested Citation:
Polygon Research, "Average Note Rate on Agency First-Time Homebuyer Purchase Loans, Fixed vs Adjustable, Jan 2018 to May 2026," Polygon Pulse - MBS Pivot, published August 28, 2026. Scope: agency purchase originations flagged first-time homebuyer, fixed-rate and adjustable-rate. Metric: average note rate by month and adjustable share of loan count. Data through May 2026; June and July 2026 excluded as incomplete. Accessed August 28, 2026.
Key insights

Fixed-rate first-time buyer purchase loans averaged 6.06% in May 2026. Adjustable-rate loans averaged 4.59%. That difference of roughly a point and a half is the widest since at least 2018, when it ran closer to 0.70 points.

Volume held flat. First-time buyer purchase loans totaled 568,248 from January through May 2026, against 578,891 in the same months of 2025 and 578,908 in 2024, a range of under 2%. What changed is the product. The adjustable share rose from 0.45% of January to May 2024 loans, to 0.51% in 2025, to 2.48% in 2026.

An adjustable-rate mortgage carries a fixed rate for an initial term, commonly five or seven years, then resets on a schedule. On a $350,000 loan, 6.06% costs about $325 a month more than 4.59% during that initial term. That is the trade being offered.

Two and a half percent is still a small share, and it says nothing about which lenders, channels or markets produced it. Explore first-time buyer lending in MBS Pivot.

From Analysis to Action

This analysis provides a clear blueprint for how to uncover meaningful market dynamics. Its true power is unleashed when you apply this same methodology to your own local markets. Because all real estate is local, this granular approach is essential for crafting precise strategies that effectively address the unique conditions of each community.

Ready to Continue? Get Your Exact Market Answers.

Go beyond generic insights. Polygon's interactive tools and limitless filtering empower you to tailor market data to your specific strategy.
Start your 7-day free trial.
Unlock My Custom Insights Now - Free Trial