01
Hazard exposure
Compare risk ratings, estimated annual loss and annualized frequency across multiple natural hazards.
TerraVision connects FEMA hazard data with mortgage and community intelligence. It helps housing professionals understand where environmental risk overlaps with lending activity, housing patterns and community characteristics.
Market intelligence for analysis and planning—not a property-level hazard determination.
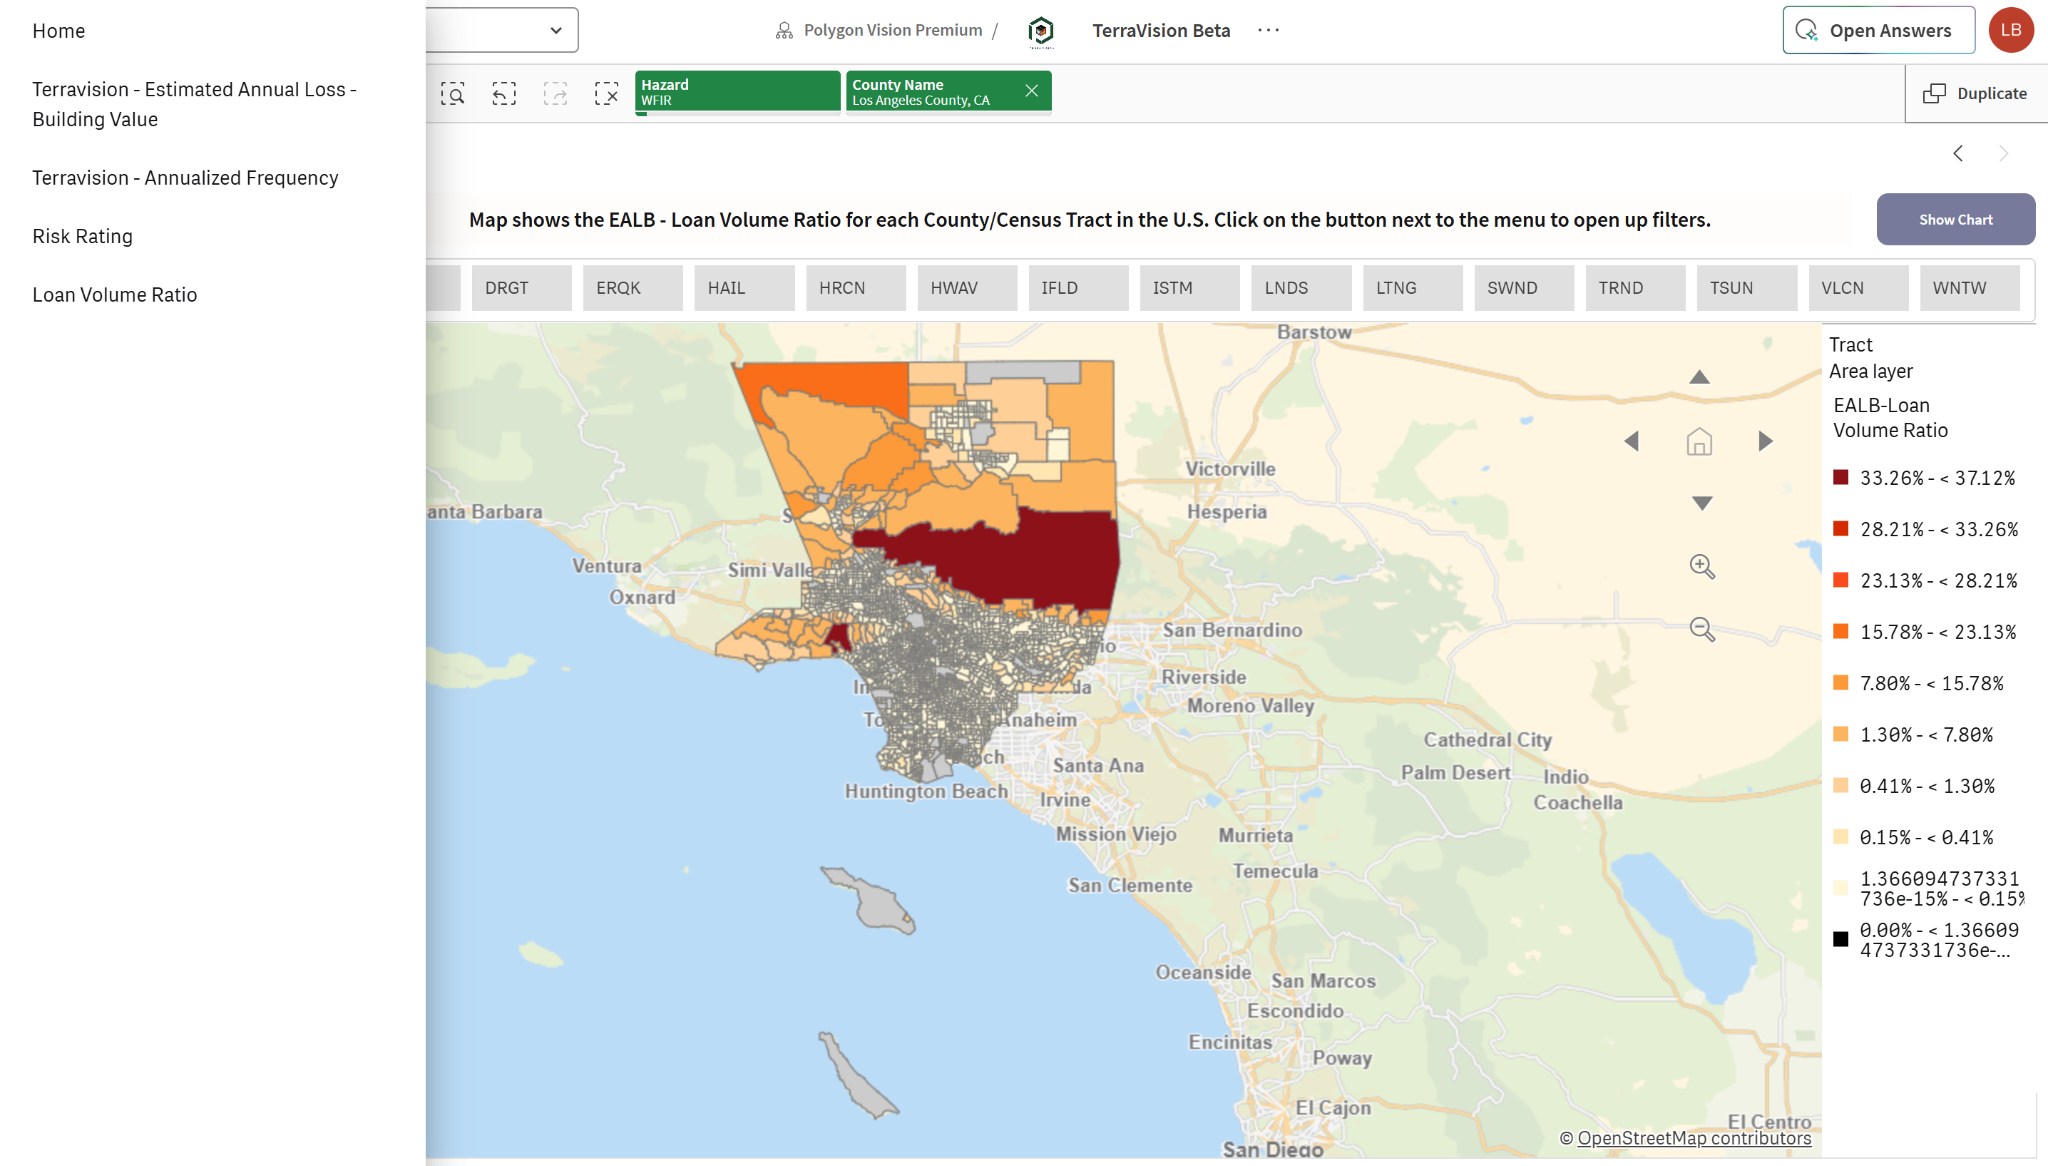
TerraVision is the environmental-risk application within Polygon Vision. It brings public hazard measures into the same analytical environment as mortgage and community data, so users can move from a national pattern to a specific market, county or census tract.
Compare risk ratings, estimated annual loss and annualized frequency across multiple natural hazards.
Study exposure alongside mortgage applications and originations to understand market context.
Connect geographic patterns with housing and demographic characteristics for more grounded analysis.
Explore national, state, county and census-tract views with hazard and location filters.
Where does elevated hazard exposure overlap with mortgage activity?
Which markets or communities warrant closer analysis?
How does exposure vary across borrowers, neighborhoods and housing markets?
Where should lenders or policymakers prioritize planning and engagement?
Switch among hazards and geographic levels to investigate different dimensions of exposure. The views below are examples from the TerraVision application.
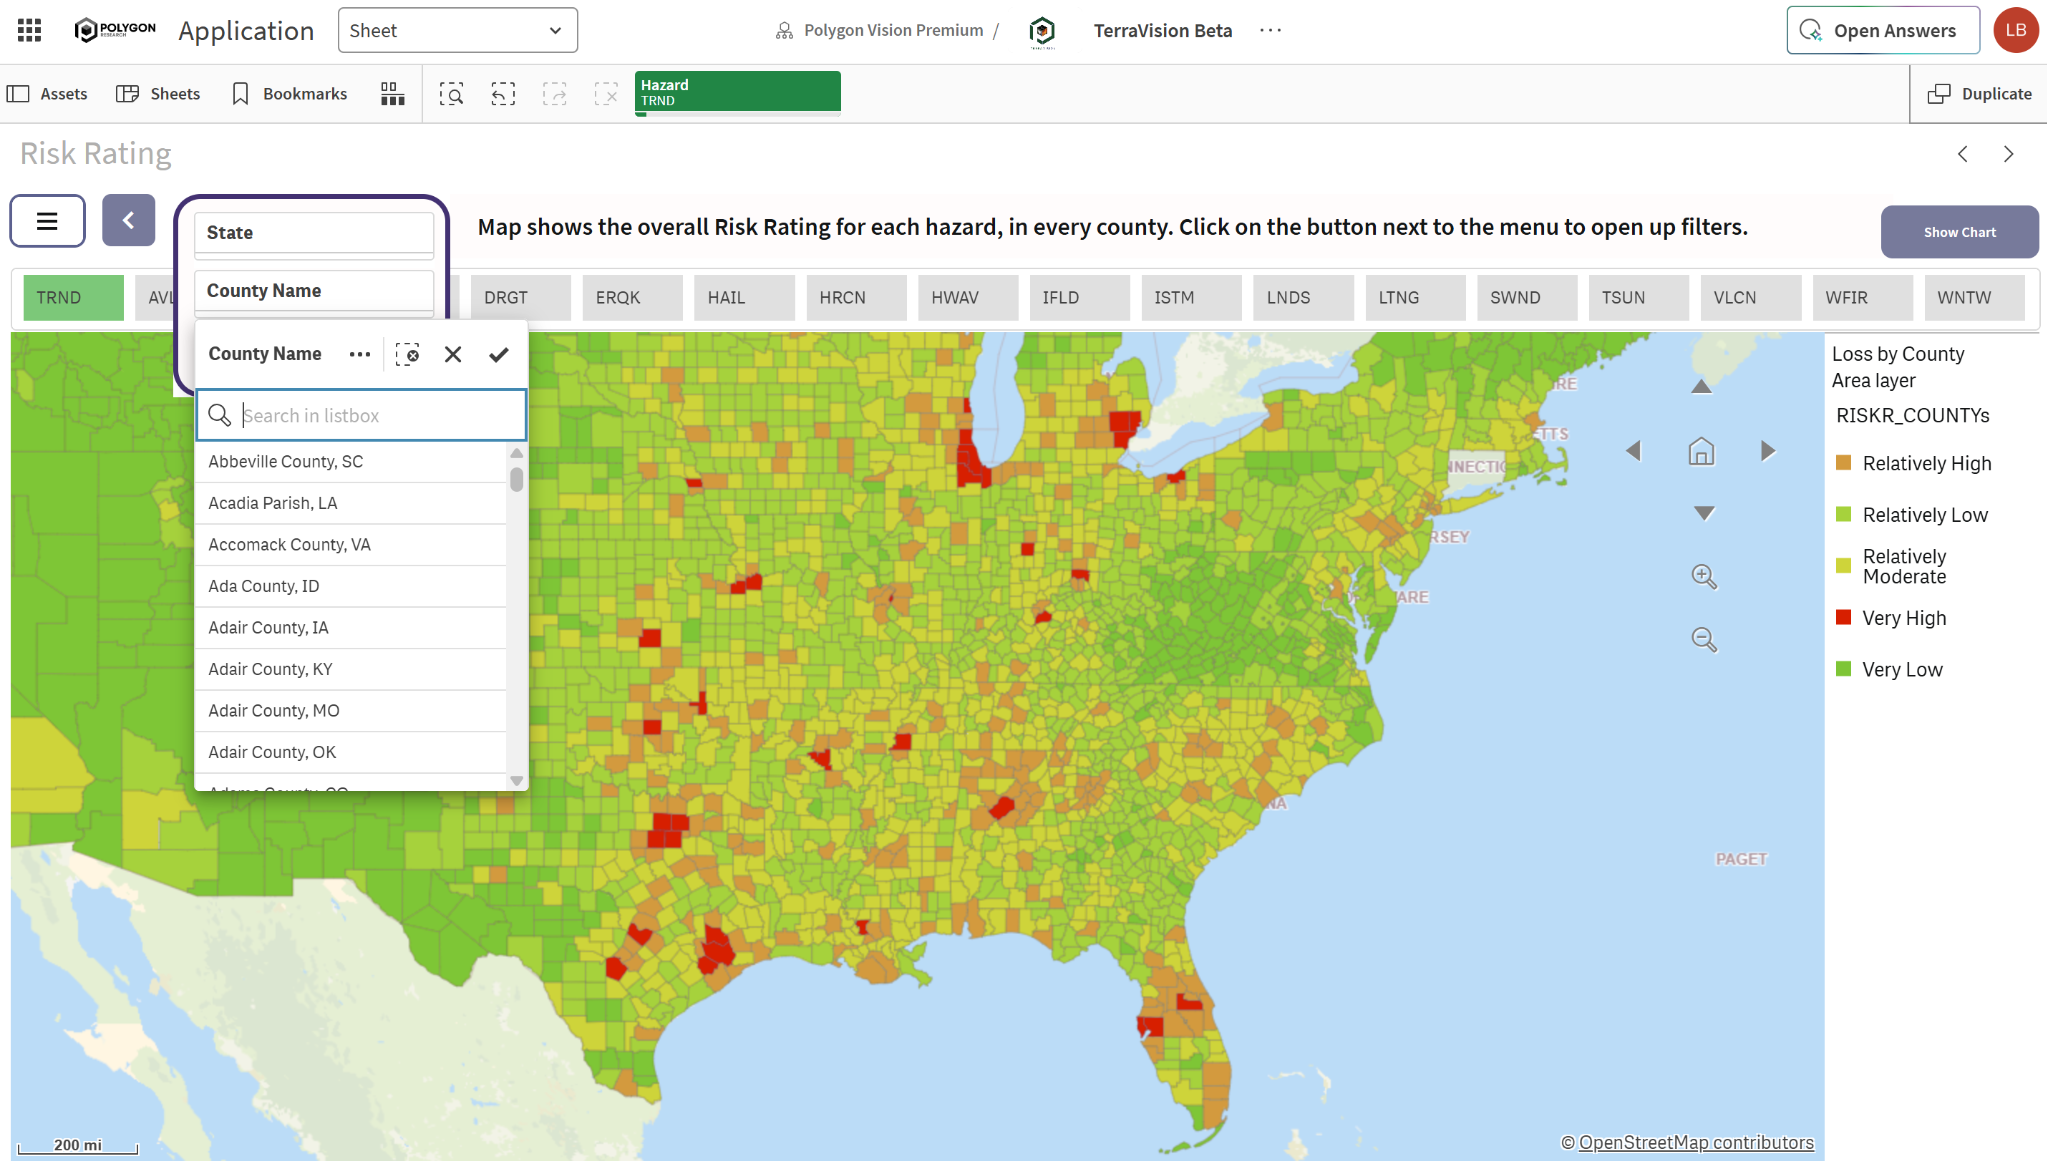
Overall Risk Rating summarizes how a county compares with others for a selected hazard. Use it to spot broad patterns and identify places for deeper review.
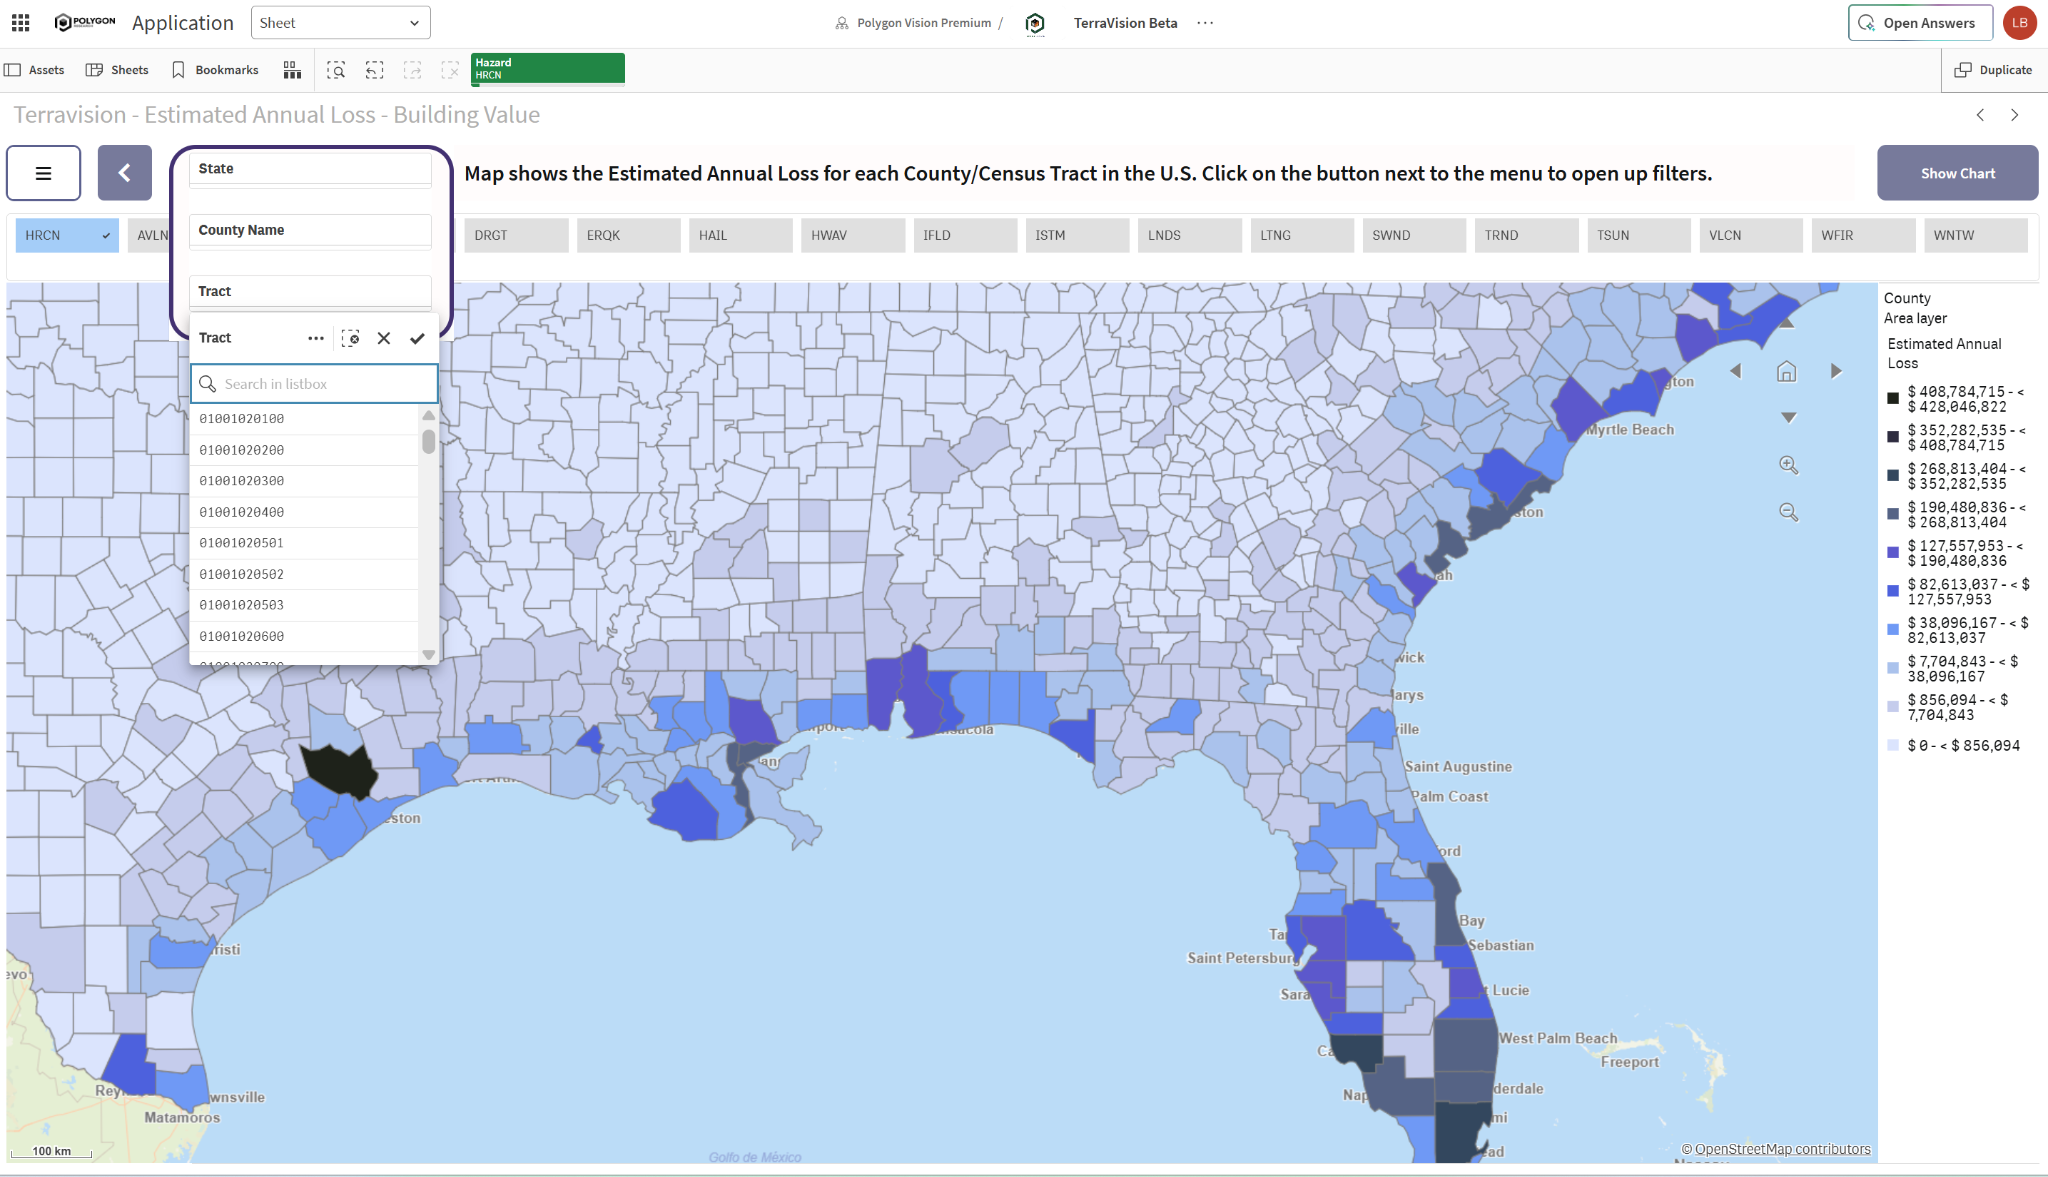
Estimated Annual Loss views help analysts compare the modeled economic impact of hazards, including the building-value component, across counties and census tracts.
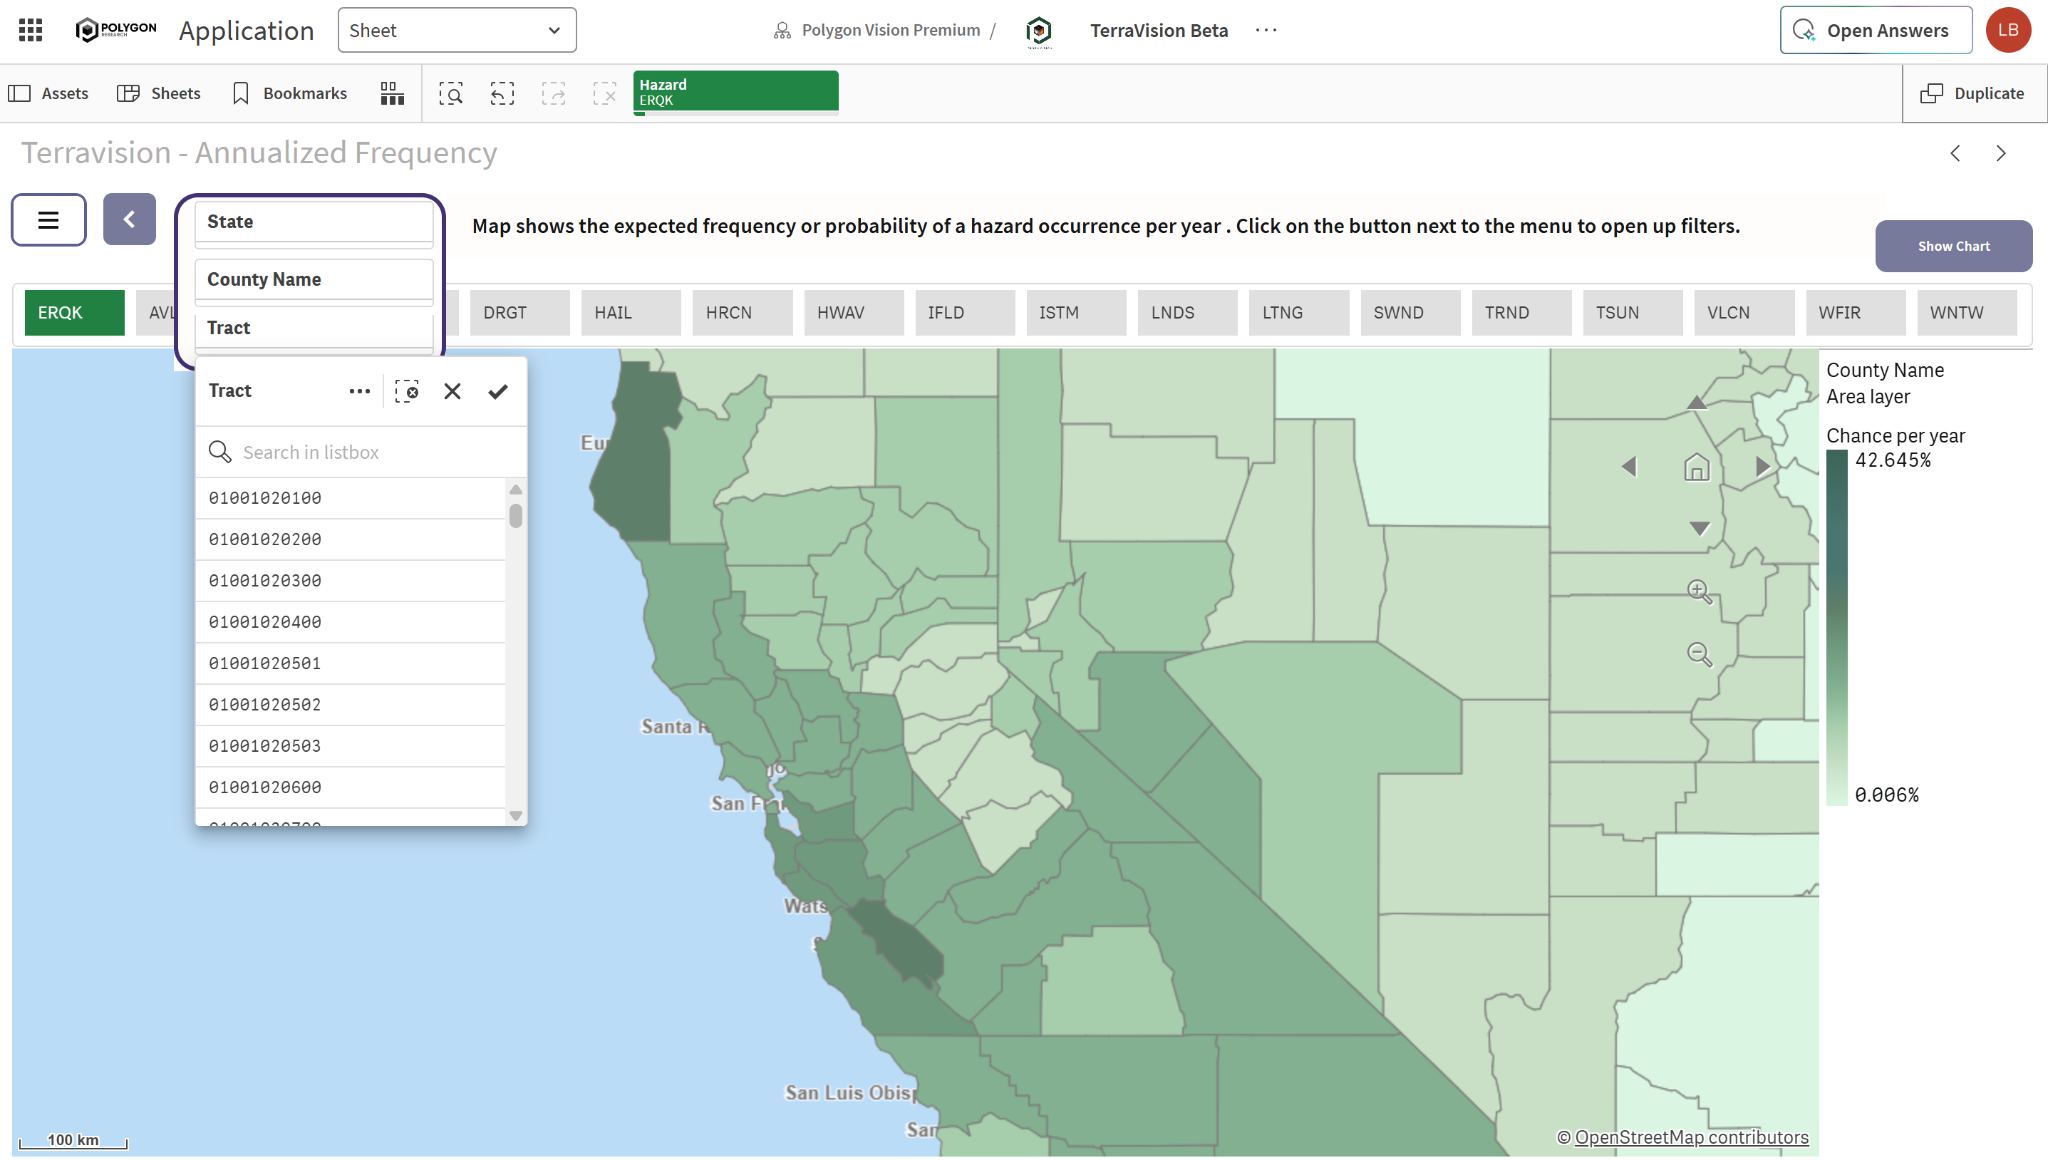
Annualized Frequency shows the modeled yearly probability or expected frequency of a selected hazard, helping users distinguish likelihood from severity.
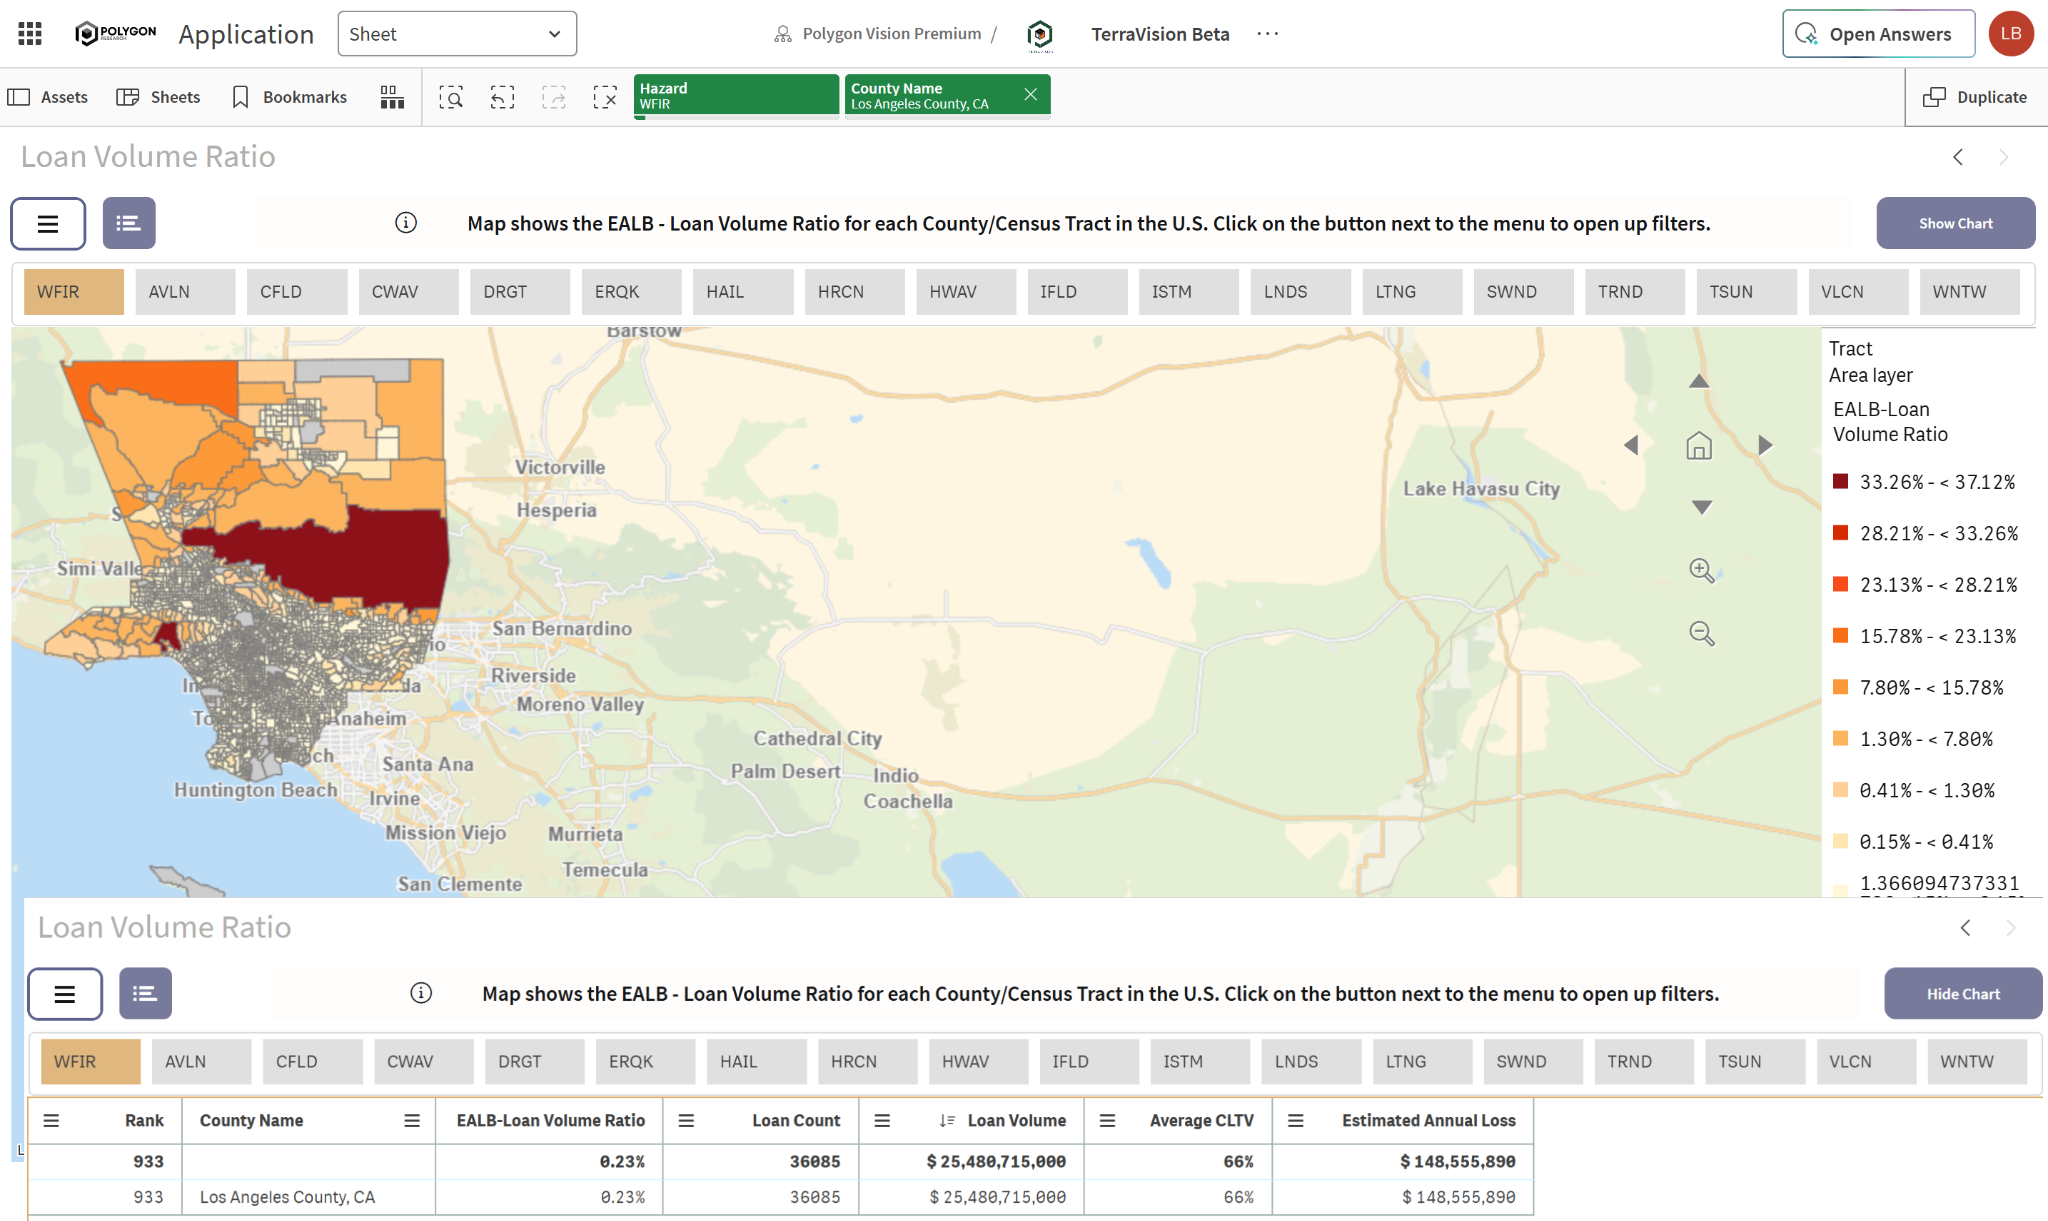
Loan Volume Ratio compares estimated annual building loss with the mortgage loan volume originated in each county or census tract. It helps users see where environmental exposure may be more significant relative to the scale of local lending.
Add geographic hazard context to market strategy, portfolio review, fair-lending analysis and community engagement.
Examine how environmental exposure intersects with housing access, neighborhood conditions and lending patterns.
Screen markets and portfolios for concentrations that may merit additional investigation or scenario analysis.
Build a clearer geographic picture for resilience planning, public policy and place-based research.
TerraVision helps users compare public hazard indicators and place them in mortgage and community context. It does not determine property-level risk, predict a future event or replace engineering, insurance, appraisal or due-diligence analysis.
See how TerraVision works alongside Polygon Vision’s mortgage and community intelligence applications.
