First-Time Homebuyer Agency Loan Outlook
First-Time Homebuyer
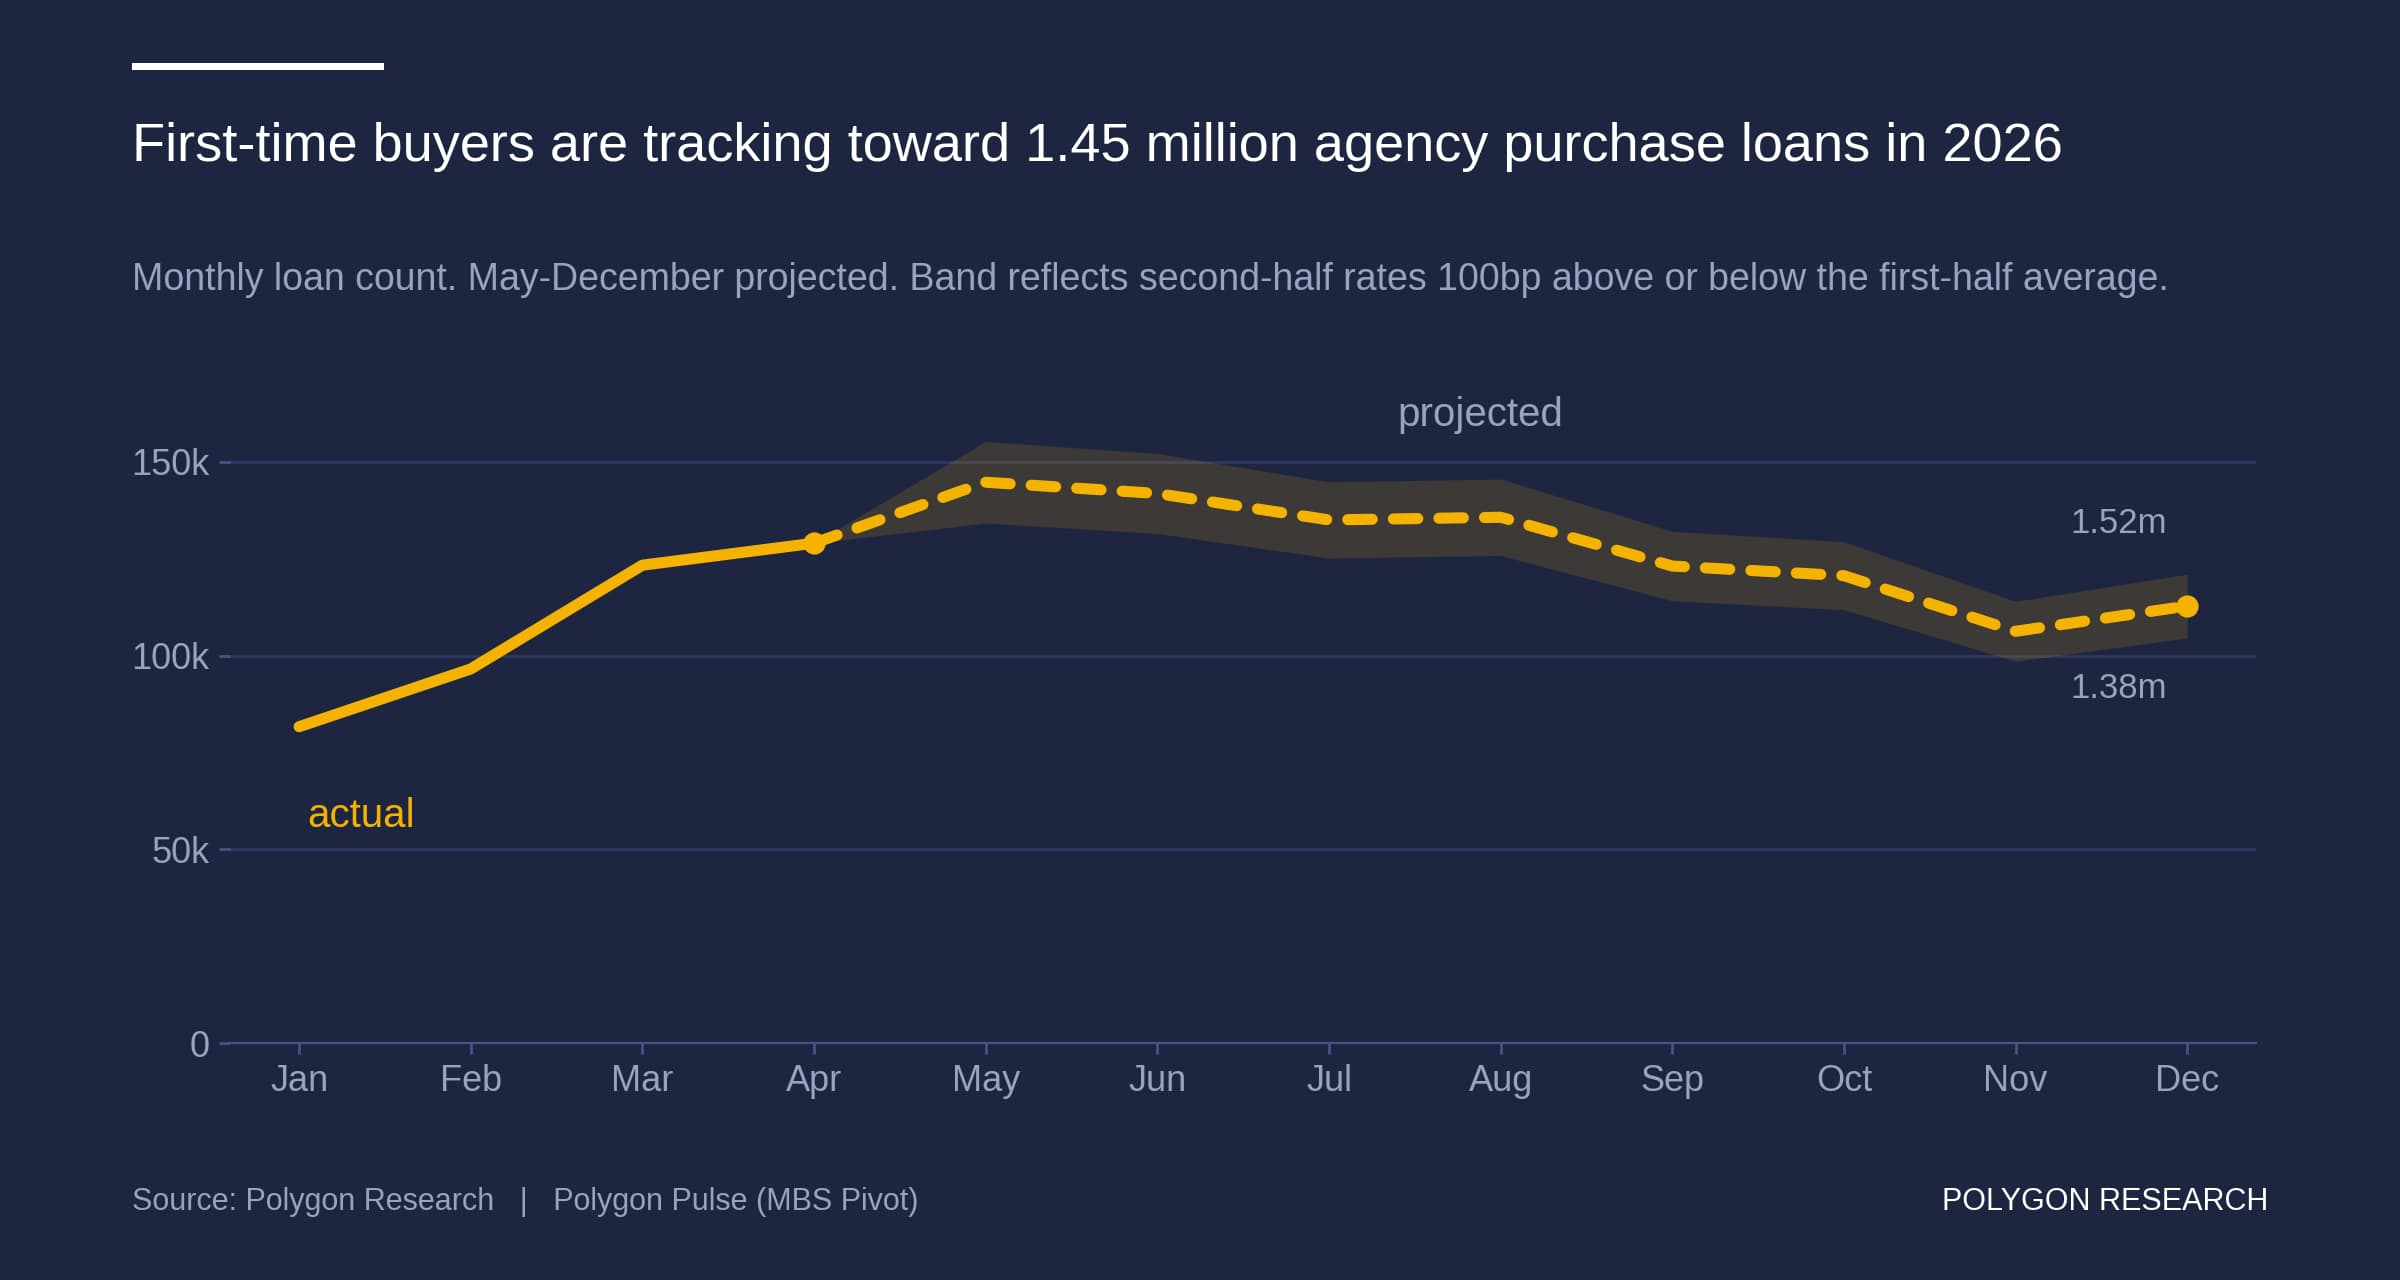
Line chart showing monthly agency first-time homebuyer purchase loans tracking toward 1.4 million in 2026, with May through December projected.
Chart Download and Page Share

Share or Download

Data Points
Case | Scenario | H2/H1 ratio | Full-year loans | Full-year volume Low | H2 rates +100 bp | 0.92 | 1,376,562 | $468 billion Central | H2 rates hold near H1 | 1.03 | 1,450,719 | $493 billion High | H2 rates -100 bp | 1.13 | 1,524,876 | $518 billion Actual January-April 2026: 430,571 loans. Estimated full first half 2026: 715,839 loans. First-half 2026 average loan amount: $339,695. First-half 2026 average rate: 5.93%. Model: H2/H1 = 1.0266 - 0.1036 x (H2 rate - H1 rate in percentage points). Fitted on 2018-2025 excluding 2020, R-squared 0.89.
How big is the first-time homebuyer market in 2026?
Polygon Research projects 1.43 million first-time buyer agency purchase loans in 2026, roughly $487 billion, within a band of 1.24 to 1.52 million.
Date Published:
July 30, 2026
Date Updated:
July 31, 2026
Chart type:
Line chart
Suggested Citation:
Polygon Research, “Monthly Agency First-Time Homebuyer Purchase Loans: 2026 Projection,” Polygon Pulse (MBS Pivot), published or updated [NEEDED: publication/update date]. Data through [NEEDED: exact data-through date]. Scope: agency purchase loans for first-time homebuyers; January–April reported and May–December projected. Metric: monthly loan count. Accessed July 27, 2026.
Key insights

Agency first-time homebuyer purchase activity is tracking toward about 1.45 million loans in 2026. The chart measures monthly agency purchase loan counts, with January–April reported and May–December projected. The projection rises into May, remains comparatively elevated through August and then moderates toward year-end.

Lenders should use this expected pattern to prepare before applications and locks reach operational teams. Production leaders can align loan-officer coverage and referral outreach with the projected spring and summer concentration, while fulfillment teams review processing, underwriting, closing and post-closing capacity. Product and training teams should ensure first-time buyer programs, underwriting requirements and borrower-education materials are ready before the projected peak.

Capital-markets and finance teams should translate the projected unit counts into expected locks, closings and funded balances using the lender’s own pull-through rates, product mix and average loan size. That distinction matters because the chart reports loan count, not dollar volume or market share. January–April results and May–December projections are not directly comparable, and the 1.38–1.52 million band reflects the 2018 through 2025 seasonal outcomes rather than a guaranteed range or stated confidence interval.

From Analysis to Action

This analysis provides a clear blueprint for how to uncover meaningful market dynamics. Its true power is unleashed when you apply this same methodology to your own local markets. Because all real estate is local, this granular approach is essential for crafting precise strategies that effectively address the unique conditions of each community.

Ready to Continue? Get Your Exact Market Answers.

Go beyond generic insights. Polygon's interactive tools and limitless filtering empower you to tailor market data to your specific strategy.
Start your 7-day free trial.
Unlock My Custom Insights Now - Free Trial