First-Time Homebuyer Loan Mix
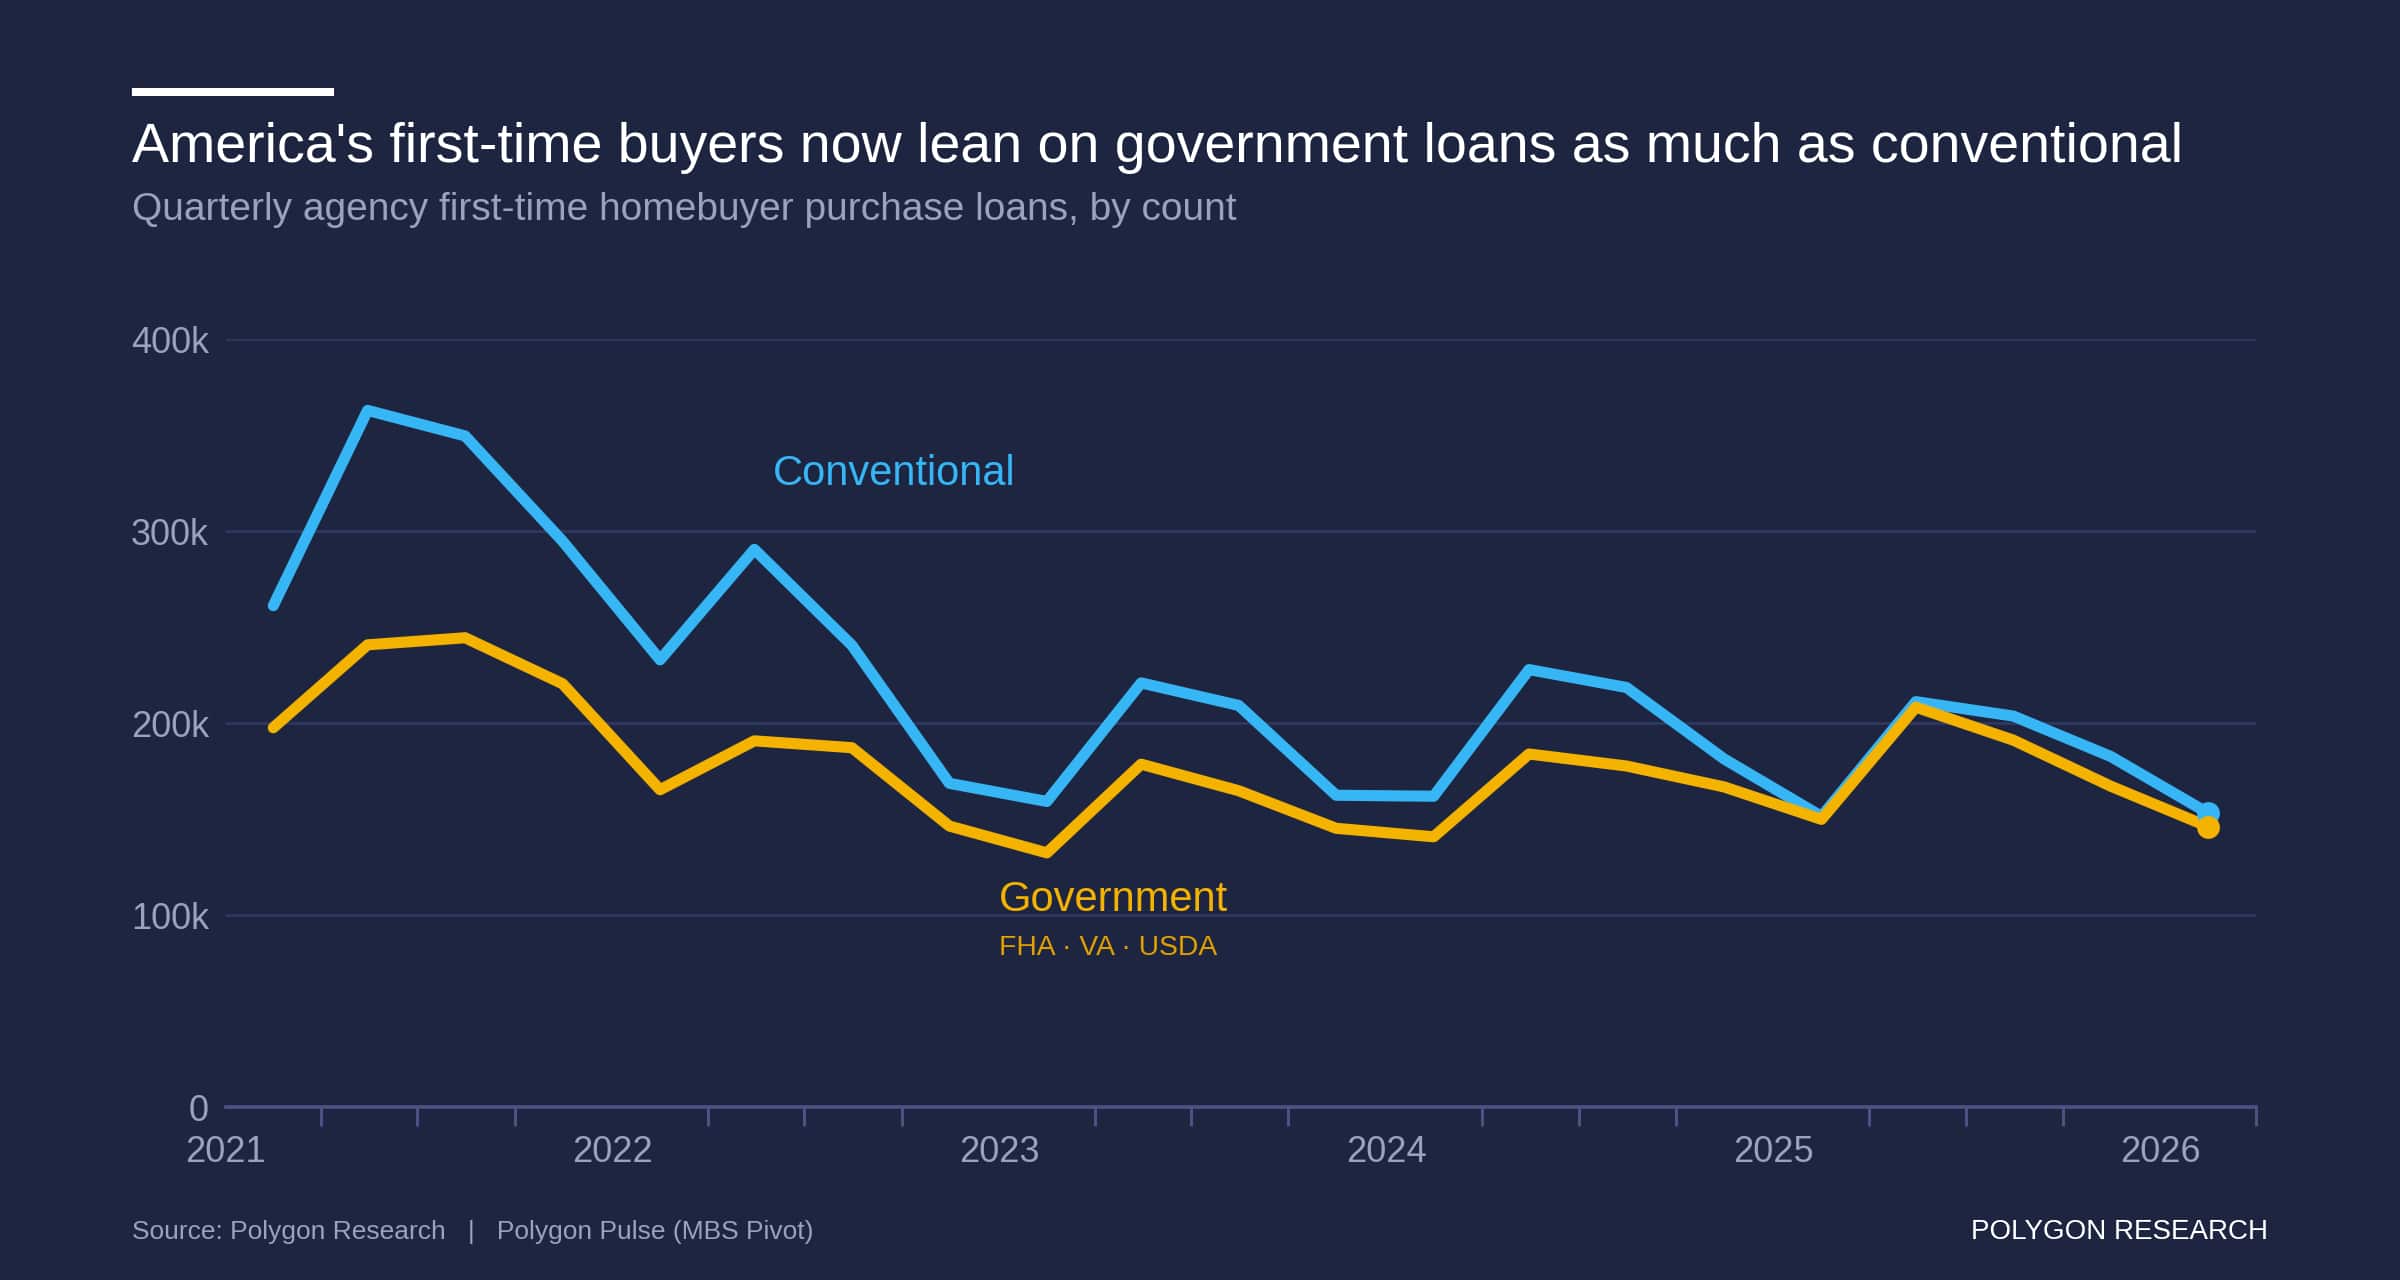
First-time buyers are using government-backed and conventional financing in nearly equal numbers. This chart measures all agency first-time homebuyer purchase originations by loan count, including fixed- and adjustable-rate mortgages across all loan terms. It compares conventional loans with the combined total for FHA, VA and USDA—not dollar volume, applications or borrower preference.
Conventional loans held a much wider lead in 2021, but the gap narrowed as both series declined and followed similar quarterly patterns. Around the May 2025 reference point, the two were nearly even; conventional remains slightly ahead in the latest quarter shown. A related Polygon analysis of the conventional and government first-time buyer profiles shows that similar loan counts can still represent borrowers with different credit, DTI and LTV characteristics.
For MLOs and lenders, the closer mix supports maintaining strong capabilities across conventional, FHA, VA and USDA lending, including pricing, training, underwriting, fulfillment and investor delivery. A separate Polygon view of first-time buyer market share in agency 30-year fixed purchase loans provides narrower product context, while its comparison of first-time homebuyer data sources explains why estimates can vary by population and definition.
From Analysis to Action
Ready to Continue? Get Your Exact Market Answers.
Start your 7-day free trial.
