Hispanic Homebuyer Loan Mix by State
Demographics
Origination Trends
Mortgage Markets
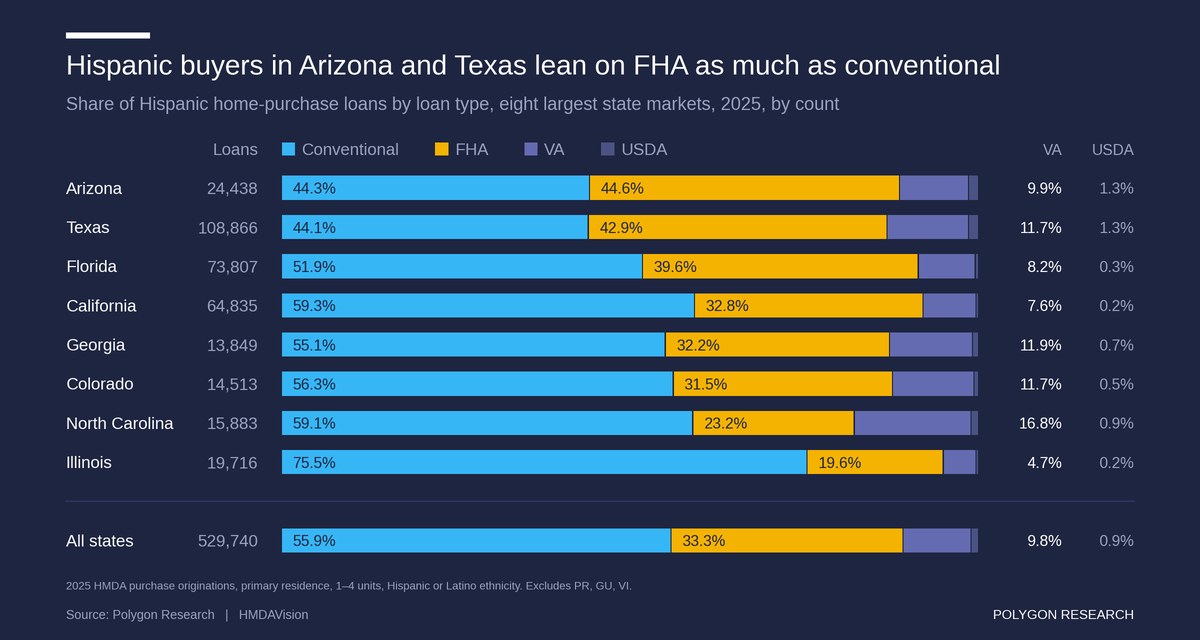
Horizontal stacked bar chart, 2025, showing how Hispanic home-purchase loans split by loan type in the eight largest state markets, sorted by FHA share. In Arizona, FHA carried 44.6% and conventional 44.3%. In Texas, conventional carried 44.1% and FHA 42.9%. Florida, California, Georgia and Colorado fall between 31% and 40% FHA. North Carolina is 23.2% FHA, with the highest VA share at 16.8%. In Illinois, conventional carried 75.5% and FHA 19.6%. Across all states, 529,740 loans split 55.9% conventional, 33.3% FHA, 9.8% VA and 0.9% USDA. Source: Polygon Research, HMDAVision.
Chart Download and Page Share

Share or Download

Data Points
Chart | Hispanic home-purchase loans by loan type | eight largest state markets | 2025 Scope | 2025 HMDA purchase originations, primary residence, 1-4 units, Hispanic or Latino ethnicity | by loan count | excludes PR, GU, VI All states | about 530,000 loans | about 56% conventional | about one-third FHA | about 10% VA | under 1% USDA FHA at parity with conventional | Arizona and Texas | each near 44% conventional and 43% to 45% FHA Lowest FHA share of the eight | Illinois | about one in five Highest VA share of the eight | North Carolina | about 17% Full state, county, MSA, tract and lender cuts | HMDAVision
How do Hispanic homebuyers finance their home purchases?
In 2025, 55.9% of Hispanic home-purchase loans were conventional and 33.3% FHA. In Arizona and Texas, FHA carried about as many loans as conventional.
Date Published:
September 25, 2026
Date Updated:
September 25, 2026
Chart type:
Bar Chart
Suggested Citation:
Polygon Research, "Hispanic Home-Purchase Loans by Loan Type, Eight Largest State Markets, 2025," HMDAVision, published September 25, 2026. Scope: 2025 HMDA home-purchase originations, primary residence, 1-4 units, Hispanic or Latino ethnicity; excludes PR, GU, VI and loans with no state reported. Metrics: share of loans by loan type (conventional, FHA, VA, USDA), by count. Accessed September 25, 2026.
Key insights

Hispanic homebuyers took out 529,740 purchase loans in 2025, and how they financed them depends heavily on where they bought. In Arizona, FHA carried 44.6% of those loans, slightly more than conventional at 44.3%. Texas, the largest market at nearly 109,000 loans, split 44.1% conventional and 42.9% FHA. In Illinois, conventional financed three of every four purchases and FHA fewer than one in five.

The national mix of 55.9% conventional and 33.3% FHA hides that range. A lender that sizes this market from the national average will misjudge the product mix in its own states. In Arizona and Texas, FHA capability, down payment assistance and loan officers fluent in government guidelines carry much of the opportunity. In Illinois and California, competition centers on conventional pricing. North Carolina stands out on VA, at 16.8% against 9.8% nationally.

HMDAVision breaks this mix down by county, MSA, census tract and lender, so a lender can compare its own FHA and conventional share with Hispanic borrowers against the market, a peer group or a specific competitor. Explore purchase lending in HMDAVision.

From Analysis to Action

This analysis provides a clear blueprint for how to uncover meaningful market dynamics. Its true power is unleashed when you apply this same methodology to your own local markets. Because all real estate is local, this granular approach is essential for crafting precise strategies that effectively address the unique conditions of each community.

Ready to Continue? Get Your Exact Market Answers.

Go beyond generic insights. Polygon's interactive tools and limitless filtering empower you to tailor market data to your specific strategy.
Start your 7-day free trial.
Unlock My Custom Insights Now - Free Trial