Non-QM Investor Lending by Metro
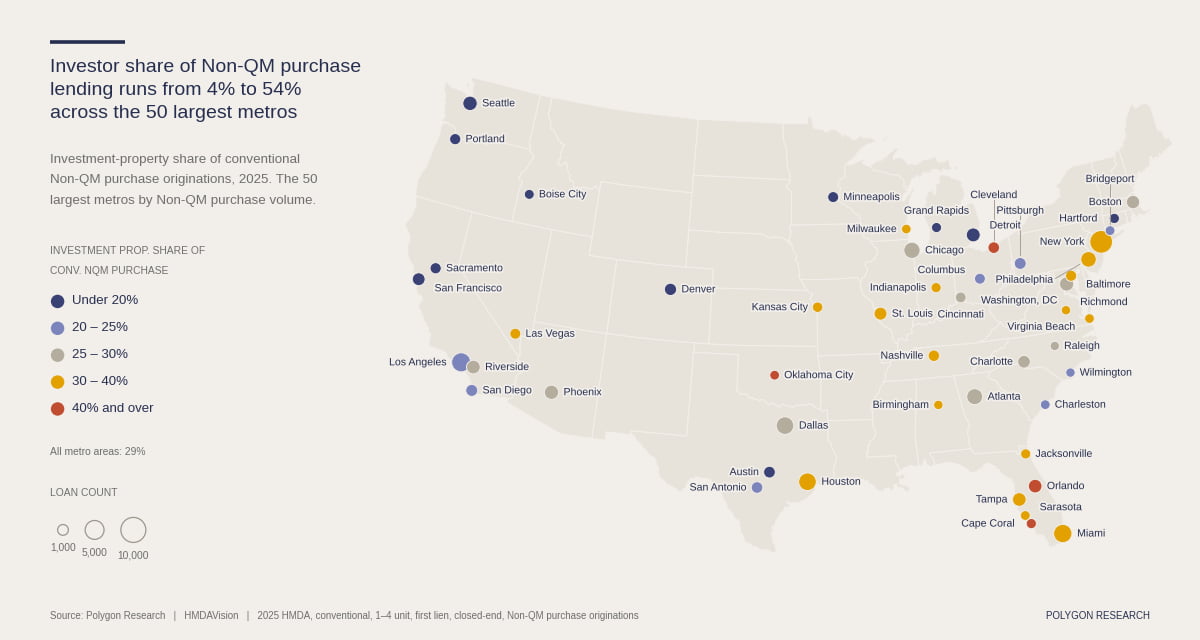
Where is Non-QM investor lending most concentrated?
Investor-property concentration varies materially by metro: this map shows the investment-property share of conventional, first-lien, closed-end, 1–4 unit Non-QM purchase originations in 2025 across the 50 largest metros by Non-QM purchase volume; bubble size represents loan count. The share spans 4% to 54%, compared with a 29% national average, showing that investor lending is a local market characteristic rather than a uniform feature of Non-QM production. Several Florida, Texas and Southeast metros sit above the national benchmark, while many Pacific Coast, Northwest and selected Mountain and Upper Midwest markets fall below 25%.
For lenders, the implication is portfolio design: product menus, broker and correspondent coverage, pricing, and capital-markets execution should be calibrated to the investor mix in each footprint.
A high share may support deeper investor-focused programs, but it should be evaluated alongside absolute loan count, competition and credit policy. A low share does not mean weak Non-QM opportunity; it may indicate a more consumer-oriented purchase market.
Comparisons should account for the chart’s two measures—share by color and volume by bubble size—and its focus on only the 50 largest metros in this segment. The data describe geographic mix, not causation, profitability or credit performance.
From Analysis to Action
Ready to Continue? Get Your Exact Market Answers.
Start your 7-day free trial.
