Rate-and-Term vs Cash-Out Refinance Volume
Refinance
Origination Trends
Loan Pricing
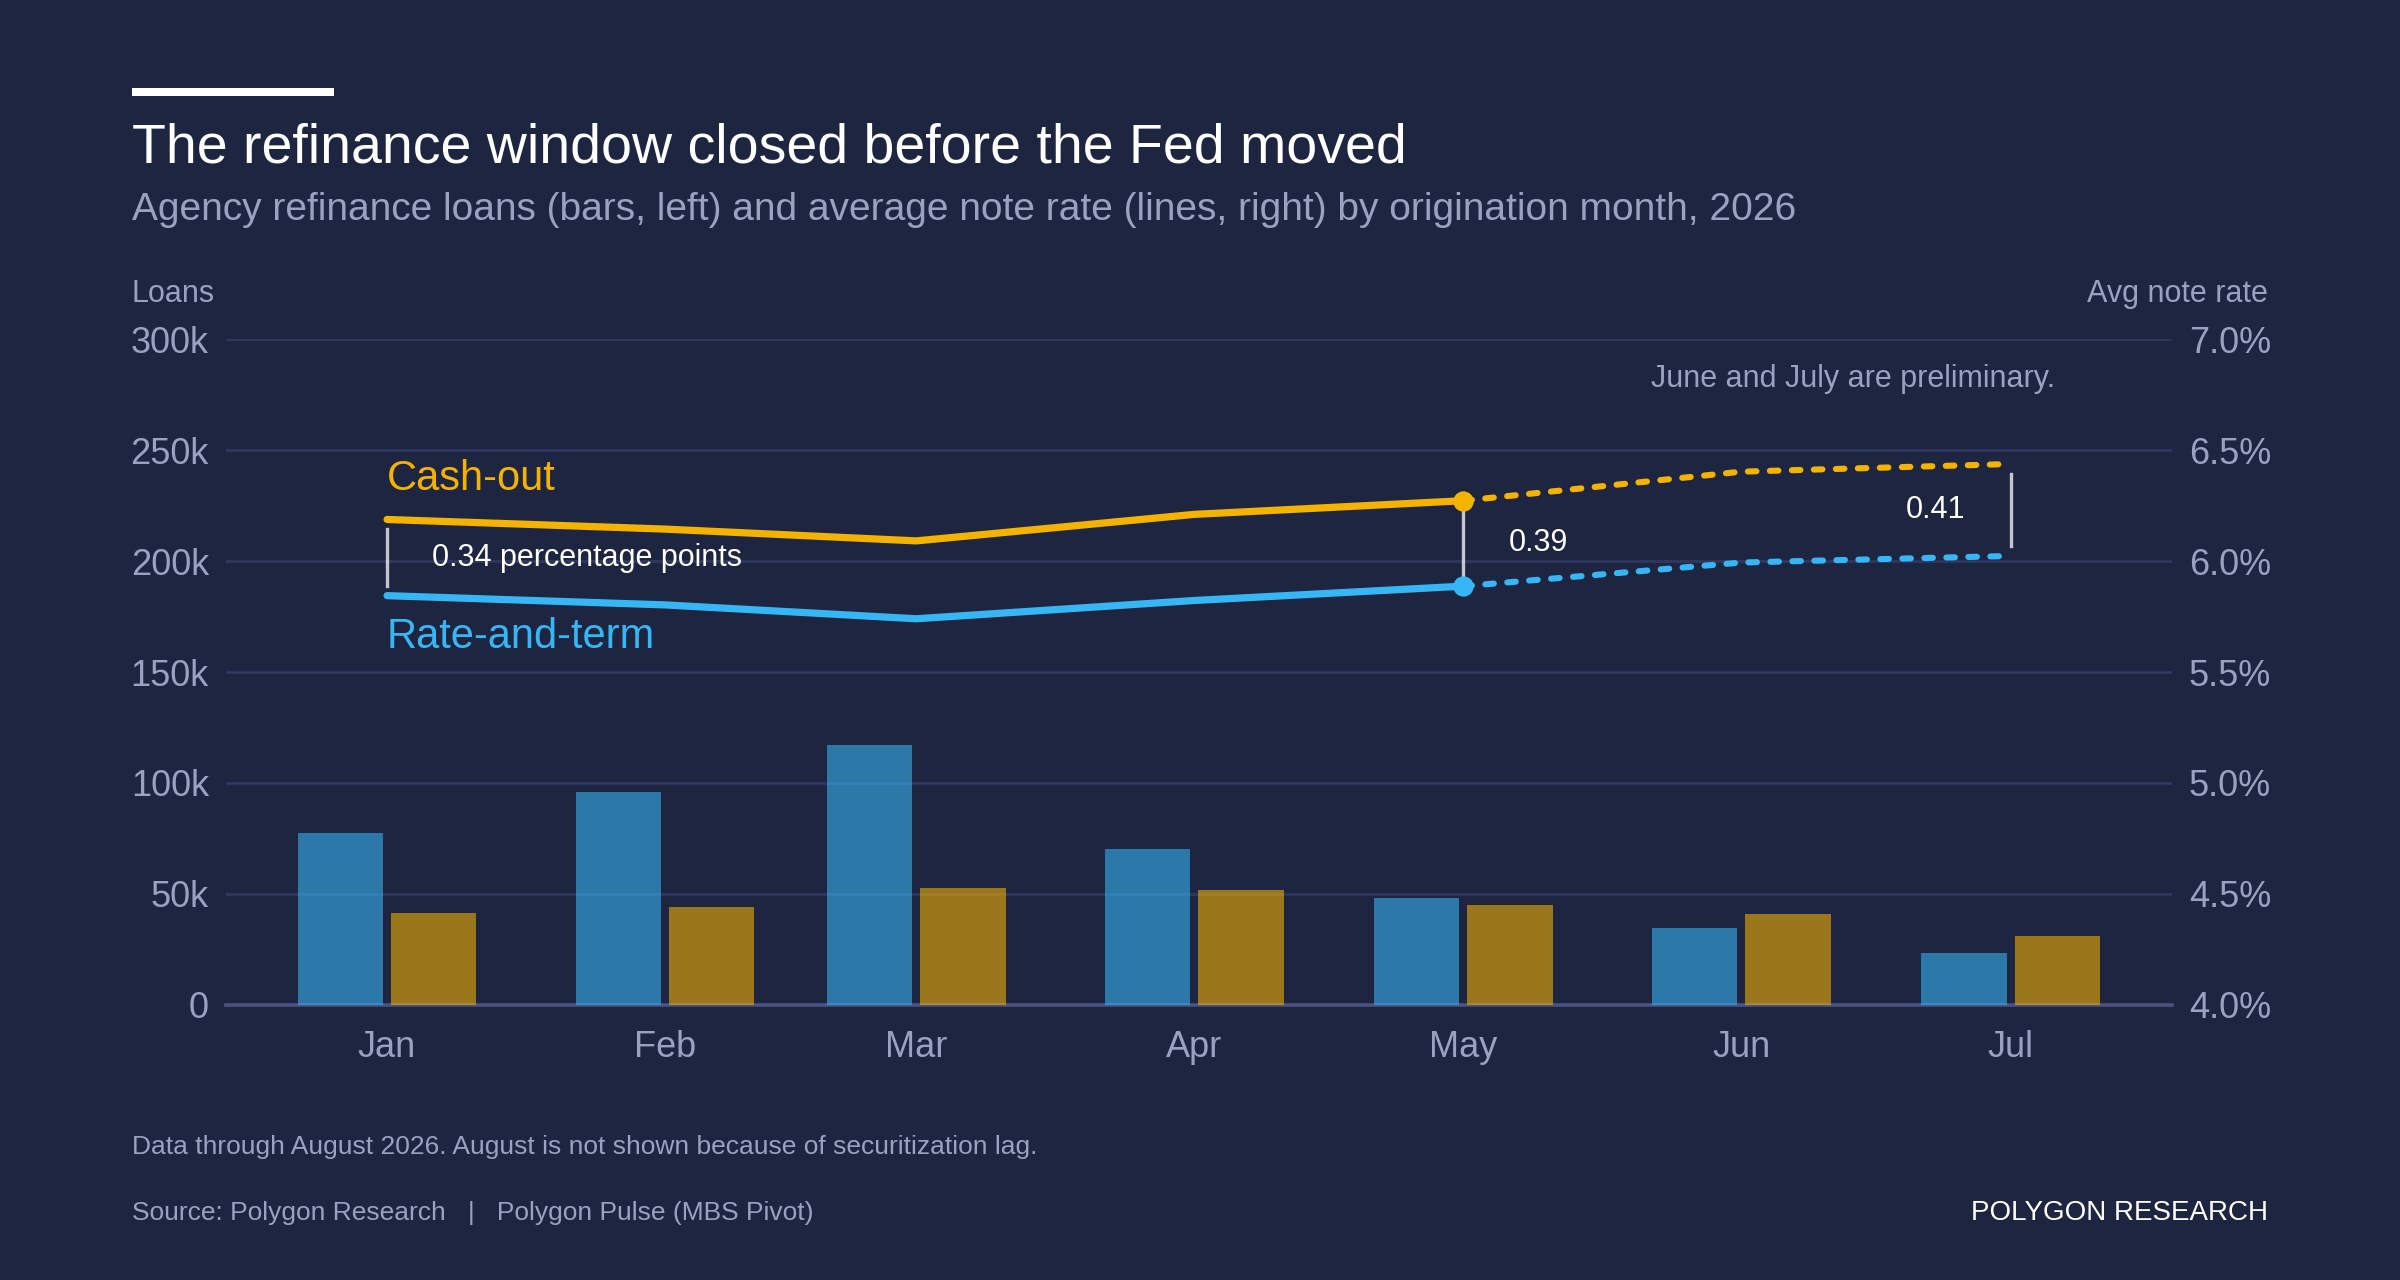
Bar and line chart, January to July 2026, monthly. Blue bars show agency rate-and-term refinance loans peaking near 117,000 in March and falling to about 48,000 in May. Gold bars show cash-out refinances holding between about 42,000 and 53,000 through May. Two lines show average note rates, cash-out above rate-and-term, with the gap widening from 0.34 percentage points in January to 0.39 in May. June and July are preliminary. Data through August 2026; August is not shown because of securitization lag. Source: Polygon Research, Polygon Pulse (MBS Pivot).
Chart Download and Page Share

Share or Download

Data Points
Chart | Agency refinance loans (bars) and average note rate (lines), rate-and-term vs cash-out | monthly by origination month | Jan to Jul 2026 Scope | Refinance loans in Fannie Mae, Freddie Mac and Ginnie Mae MBS | by loan count | data through August 2026 | August not shown because of securitization lag | June and July 2026 preliminary Rate-and-term refinances | peak March 2026 about 117,000 | May 2026 about 48,000 | down 59% Cash-out refinances | March 2026 about 52,600 | May 2026 about 44,800 | down 15% Average note rate, rate-and-term | March 5.74% | May 5.89% | up 0.15 percentage points Average note rate, cash-out | March 6.09% | May 6.27% Cash-out rate premium over rate-and-term | 0.34 percentage points in January | 0.39 in May | 0.41 in July preliminary Cash-out share of agency refinances, by count | March 31% | May 48% | June 54% preliminary | July 57% preliminary Average DTI | cash-out near 39% all year | rate-and-term 35% in March, 37% in May Federal Reserve | raised the federal funds target range 0.25 percentage points to 3.75%-4.00% on September 16, 2026 | first increase since July 2023 Full monthly series, and cuts by seller/issuer, loan type, credit score, LTV and state | Polygon Pulse, MBS Pivot
What happened to mortgage refinancing before the Fed raised rates?
Agency rate-and-term refinances fell 59% from March to May 2026 as the average note rate rose 0.15 percentage points. Cash-out refinances slipped 15%, and by May the two were nearly even.
Date Published:
September 18, 2026
Date Updated:
September 18, 2026
Chart type:
Line Chart
Suggested Citation:
Polygon Research, "Agency Refinance Loans and Average Note Rate, Rate-and-Term vs Cash-Out, Jan to Jul 2026," Polygon Pulse – MBS Pivot, published September 18, 2026. Scope: refinance loans in Fannie Mae, Freddie Mac and Ginnie Mae MBS by origination month. Metrics: loan count and count-weighted average note rate by refinance purpose; cash-out rate premium in percentage points. Data through August 2026; August is not shown because of securitization lag; June and July 2026 are preliminary. Accessed September 18, 2026.
Key insights

Agency rate-and-term refinances fell 59% between March and May 2026, from about 117,000 loans to about 48,000. The average note rate on those loans rose 0.15 percentage points over the same two months, from 5.74% to 5.89%. The Federal Reserve raised its target rate on September 16. The refinance window had closed five months earlier.

Cash-out refinances slipped 15% over the same stretch. Borrowers taking cash out paid 0.34 percentage points more than rate-and-term borrowers in January and 0.39 more in May, and their average debt-to-income ratio held near 39% all year. That demand comes from a need for cash, and it holds when rates rise. Preliminary June and July counts show cash-out as the majority of agency refinances.

For loan officers, the refinance conversation left in this market is about equity. For homeowners, a Fed increase passes through quickly to HELOCs and credit cards priced off the prime rate. A fixed-rate cash-out refinance locks the cost of that debt.

The national lines hide the spread underneath. Cash-out share, pricing and borrower credit differ by state, by seller/issuer and by loan type. Explore refinance lending in MBS Pivot.

From Analysis to Action

This analysis provides a clear blueprint for how to uncover meaningful market dynamics. Its true power is unleashed when you apply this same methodology to your own local markets. Because all real estate is local, this granular approach is essential for crafting precise strategies that effectively address the unique conditions of each community.

Ready to Continue? Get Your Exact Market Answers.

Go beyond generic insights. Polygon's interactive tools and limitless filtering empower you to tailor market data to your specific strategy.
Start your 7-day free trial.
Unlock My Custom Insights Now - Free Trial